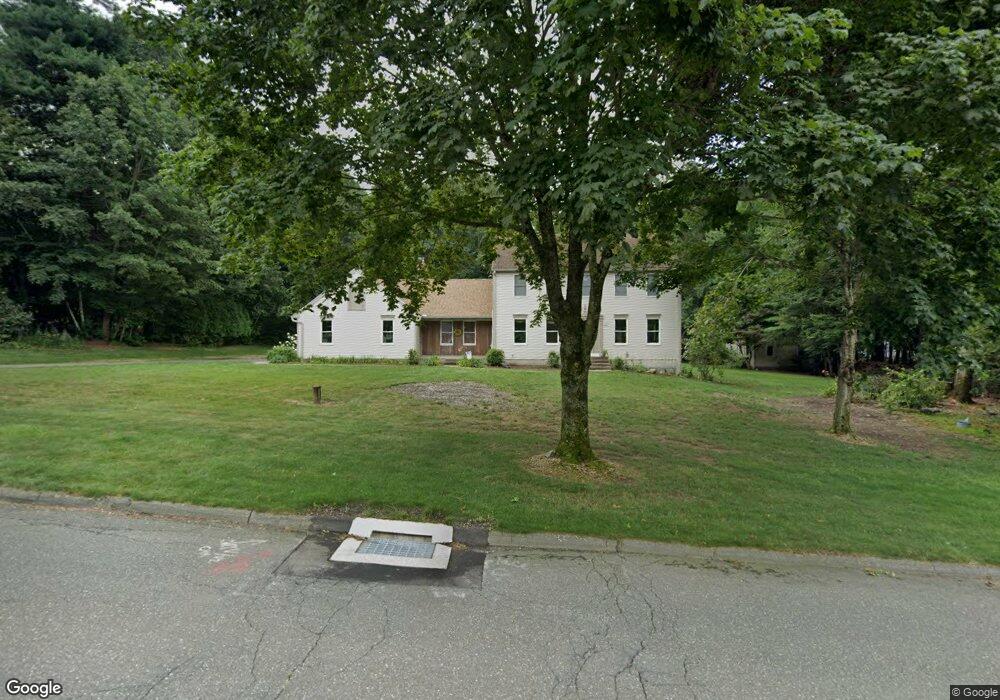
15 Red Gap Rd Wilbraham, MA 01095
Estimated Value: $661,466 - $890,000
4
Beds
3
Baths
3,024
Sq Ft
$252/Sq Ft
Est. Value
About This Home
This home is located at 15 Red Gap Rd, Wilbraham, MA 01095 and is currently estimated at $760,617, approximately $251 per square foot. 15 Red Gap Rd is a home located in Hampden County with nearby schools including Minnechaug Regional High School and Wilbraham & Monson Academy.
Ownership History
Date
Name
Owned For
Owner Type
Purchase Details
Closed on
Mar 4, 1992
Sold by
Murphy James M
Bought by
Guihan Timothy P and Guihan Tammey M
Current Estimated Value
Home Financials for this Owner
Home Financials are based on the most recent Mortgage that was taken out on this home.
Original Mortgage
$135,000
Interest Rate
8.5%
Mortgage Type
Purchase Money Mortgage
Create a Home Valuation Report for This Property
The Home Valuation Report is an in-depth analysis detailing your home's value as well as a comparison with similar homes in the area
Home Values in the Area
Average Home Value in this Area
Purchase History
| Date | Buyer | Sale Price | Title Company |
|---|---|---|---|
| Guihan Timothy P | $195,000 | -- |
Source: Public Records
Mortgage History
| Date | Status | Borrower | Loan Amount |
|---|---|---|---|
| Open | Guihan Timothy P | $265,000 | |
| Closed | Guihan Timothy P | $50,000 | |
| Closed | Guihan Timothy P | $135,000 | |
| Closed | Guihan Timothy P | $135,000 |
Source: Public Records
Tax History
| Year | Tax Paid | Tax Assessment Tax Assessment Total Assessment is a certain percentage of the fair market value that is determined by local assessors to be the total taxable value of land and additions on the property. | Land | Improvement |
|---|---|---|---|---|
| 2025 | $11,112 | $621,500 | $132,100 | $489,400 |
| 2024 | $10,858 | $586,900 | $132,100 | $454,800 |
| 2023 | $9,800 | $527,700 | $132,100 | $395,600 |
| 2022 | $9,800 | $478,300 | $132,100 | $346,200 |
| 2021 | $9,558 | $416,300 | $130,600 | $285,700 |
| 2020 | $9,317 | $416,300 | $130,600 | $285,700 |
| 2019 | $9,078 | $416,400 | $130,600 | $285,800 |
| 2018 | $9,047 | $399,600 | $130,600 | $269,000 |
| 2017 | $8,791 | $399,600 | $130,600 | $269,000 |
| 2016 | $8,744 | $404,800 | $144,600 | $260,200 |
| 2015 | $8,452 | $404,800 | $144,600 | $260,200 |
Source: Public Records
Map
Nearby Homes
Your Personal Tour Guide
Ask me questions while you tour the home.