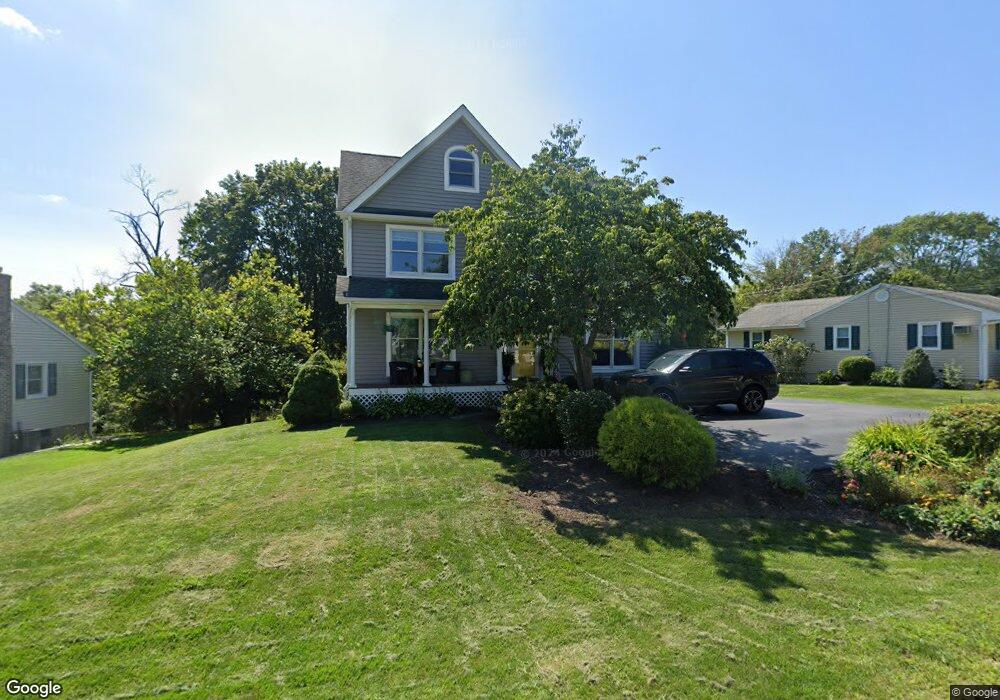
15 Ridge Rd High Bridge, NJ 08829
Estimated Value: $570,052 - $636,000
--
Bed
--
Bath
2,034
Sq Ft
$295/Sq Ft
Est. Value
About This Home
This home is located at 15 Ridge Rd, High Bridge, NJ 08829 and is currently estimated at $600,263, approximately $295 per square foot. 15 Ridge Rd is a home located in Hunterdon County with nearby schools including High Bridge Elementary School, High Bridge Middle School, and Voorhees High School.
Ownership History
Date
Name
Owned For
Owner Type
Purchase Details
Closed on
Jan 17, 2002
Sold by
Bove Michael J
Bought by
Beck Eric H and Beck Lauren S
Current Estimated Value
Home Financials for this Owner
Home Financials are based on the most recent Mortgage that was taken out on this home.
Original Mortgage
$187,400
Outstanding Balance
$77,179
Interest Rate
7.15%
Estimated Equity
$523,084
Purchase Details
Closed on
Nov 13, 1992
Sold by
Ferrullo Leslie M
Bought by
Bove Michael J and Bove Jill D
Purchase Details
Closed on
May 20, 1992
Sold by
Miller Edward A and Miller Patricia T
Bought by
Ferrullo Leslie M
Create a Home Valuation Report for This Property
The Home Valuation Report is an in-depth analysis detailing your home's value as well as a comparison with similar homes in the area
Home Values in the Area
Average Home Value in this Area
Purchase History
| Date | Buyer | Sale Price | Title Company |
|---|---|---|---|
| Beck Eric H | $234,250 | -- | |
| Bove Michael J | $90,000 | -- | |
| Ferrullo Leslie M | $35,000 | -- |
Source: Public Records
Mortgage History
| Date | Status | Borrower | Loan Amount |
|---|---|---|---|
| Open | Beck Eric H | $187,400 |
Source: Public Records
Tax History Compared to Growth
Tax History
| Year | Tax Paid | Tax Assessment Tax Assessment Total Assessment is a certain percentage of the fair market value that is determined by local assessors to be the total taxable value of land and additions on the property. | Land | Improvement |
|---|---|---|---|---|
| 2025 | $13,630 | $484,600 | $183,300 | $301,300 |
| 2024 | $12,246 | $417,600 | $145,400 | $272,200 |
| 2023 | $12,246 | $309,700 | $109,700 | $200,000 |
| 2022 | $11,846 | $278,400 | $96,400 | $182,000 |
| 2021 | $11,575 | $278,500 | $96,400 | $182,100 |
| 2020 | $11,447 | $279,200 | $96,400 | $182,800 |
| 2019 | $11,575 | $280,200 | $96,400 | $183,800 |
| 2018 | $11,041 | $278,600 | $93,800 | $184,800 |
| 2017 | $11,620 | $301,500 | $103,300 | $198,200 |
| 2016 | $11,484 | $301,500 | $103,300 | $198,200 |
| 2015 | $11,174 | $301,500 | $103,300 | $198,200 |
| 2014 | $11,237 | $352,700 | $138,400 | $214,300 |
Source: Public Records
Map
Nearby Homes