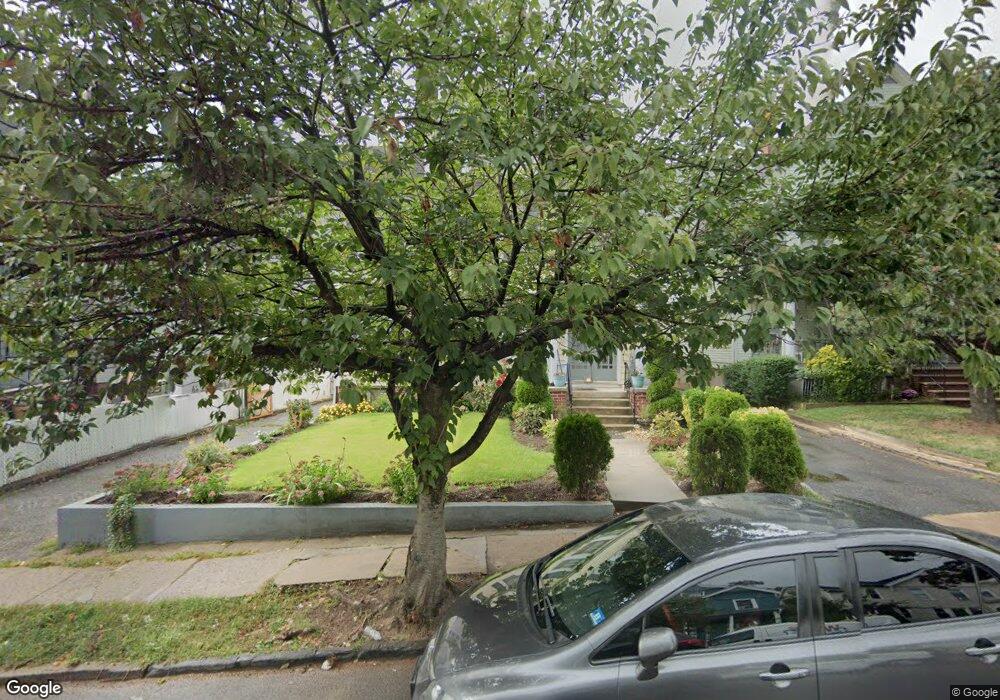
15 Ridge St Orange, NJ 07050
Estimated Value: $592,000 - $840,000
--
Bed
--
Bath
3,268
Sq Ft
$210/Sq Ft
Est. Value
About This Home
This home is located at 15 Ridge St, Orange, NJ 07050 and is currently estimated at $687,132, approximately $210 per square foot. 15 Ridge St is a home located in Essex County with nearby schools including East Orange Community Charter School.
Ownership History
Date
Name
Owned For
Owner Type
Purchase Details
Closed on
Nov 17, 2006
Sold by
Edbrook Joseph
Bought by
Jerez Nancy
Current Estimated Value
Home Financials for this Owner
Home Financials are based on the most recent Mortgage that was taken out on this home.
Original Mortgage
$319,200
Outstanding Balance
$197,068
Interest Rate
7%
Mortgage Type
Adjustable Rate Mortgage/ARM
Estimated Equity
$490,064
Purchase Details
Closed on
Sep 29, 1998
Sold by
Emc Mortgage
Bought by
Edbrook Joseph and Venses Joseph
Home Financials for this Owner
Home Financials are based on the most recent Mortgage that was taken out on this home.
Original Mortgage
$124,200
Interest Rate
6.89%
Create a Home Valuation Report for This Property
The Home Valuation Report is an in-depth analysis detailing your home's value as well as a comparison with similar homes in the area
Home Values in the Area
Average Home Value in this Area
Purchase History
| Date | Buyer | Sale Price | Title Company |
|---|---|---|---|
| Jerez Nancy | $399,000 | -- | |
| Edbrook Joseph | $138,000 | -- |
Source: Public Records
Mortgage History
| Date | Status | Borrower | Loan Amount |
|---|---|---|---|
| Open | Jerez Nancy | $319,200 | |
| Previous Owner | Edbrook Joseph | $124,200 |
Source: Public Records
Tax History Compared to Growth
Tax History
| Year | Tax Paid | Tax Assessment Tax Assessment Total Assessment is a certain percentage of the fair market value that is determined by local assessors to be the total taxable value of land and additions on the property. | Land | Improvement |
|---|---|---|---|---|
| 2025 | $19,276 | $517,200 | $100,900 | $416,300 |
| 2024 | $19,276 | $517,200 | $100,900 | $416,300 |
| 2022 | $17,926 | $517,200 | $100,900 | $416,300 |
| 2021 | $17,080 | $295,500 | $86,500 | $209,000 |
| 2020 | $16,569 | $295,500 | $86,500 | $209,000 |
| 2019 | $15,706 | $295,500 | $86,500 | $209,000 |
| 2018 | $15,455 | $295,500 | $86,500 | $209,000 |
| 2017 | $14,391 | $295,500 | $86,500 | $209,000 |
| 2016 | $14,119 | $295,500 | $86,500 | $209,000 |
| 2015 | $13,750 | $295,500 | $86,500 | $209,000 |
| 2014 | $13,147 | $295,500 | $86,500 | $209,000 |
Source: Public Records
Map
Nearby Homes