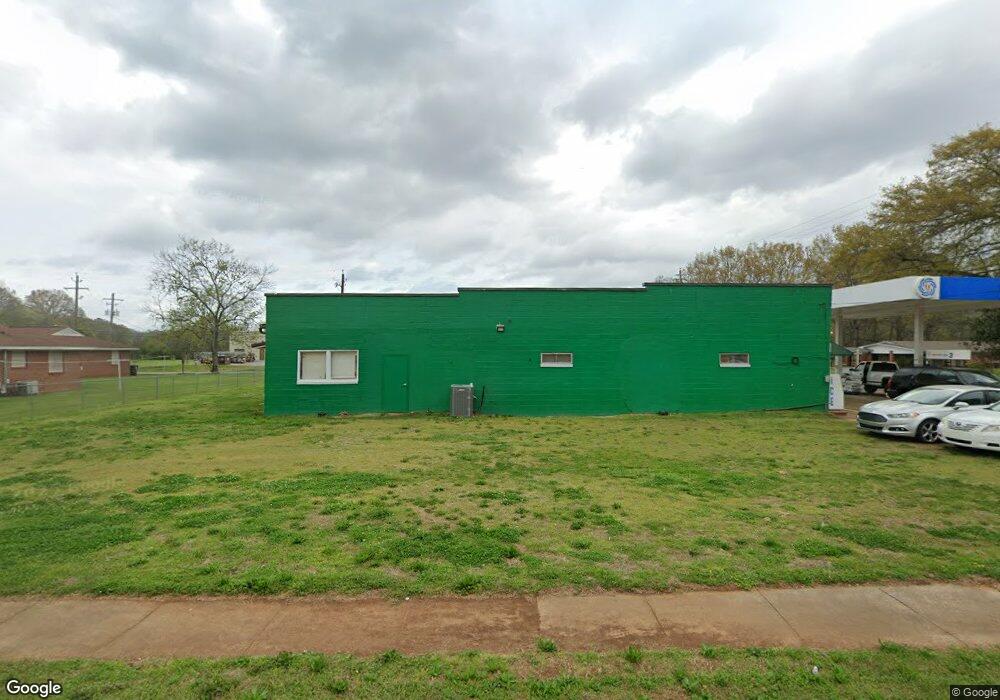
15 Rome St Cave Spring, GA 30124
Estimated Value: $1,017,060
--
Bed
--
Bath
3,312
Sq Ft
$307/Sq Ft
Est. Value
About This Home
This home is located at 15 Rome St, Cave Spring, GA 30124 and is currently estimated at $1,017,060, approximately $307 per square foot. 15 Rome St is a home located in Floyd County with nearby schools including Coosa Middle School and Coosa High School.
Ownership History
Date
Name
Owned For
Owner Type
Purchase Details
Closed on
Jun 7, 2024
Sold by
Pahari Deepak
Bought by
Rokaya Hari Devi
Current Estimated Value
Purchase Details
Closed on
Aug 26, 2020
Sold by
Hicks Holding Llc
Bought by
Pahari Deepak
Purchase Details
Closed on
Nov 18, 2016
Sold by
Jennifer
Bought by
Hicks Holding Llc
Purchase Details
Closed on
Mar 20, 2006
Sold by
Not Provided
Bought by
Harbin Jennifer
Purchase Details
Closed on
Dec 13, 2005
Sold by
Harbin Paulette G
Bought by
Harbin Paulette G
Purchase Details
Closed on
Apr 6, 1993
Sold by
Harbin Julie B
Bought by
Harbin Warren Danny
Purchase Details
Closed on
Jun 18, 1991
Sold by
Harbin Emmitt
Bought by
Harbin Julie B
Purchase Details
Closed on
Sep 27, 1976
Sold by
Lipham Harold and Lipham Clark
Bought by
Harbin Emmitt
Purchase Details
Closed on
Jan 1, 1975
Sold by
Fincher Dan
Bought by
Lipham Harold and Lipham Clark
Purchase Details
Closed on
May 4, 1964
Sold by
Fincher Ras Wilmier Mrs
Bought by
Fincher Dan
Purchase Details
Closed on
Jan 1, 1937
Bought by
Fincher Ras Wilmier Mrs
Create a Home Valuation Report for This Property
The Home Valuation Report is an in-depth analysis detailing your home's value as well as a comparison with similar homes in the area
Home Values in the Area
Average Home Value in this Area
Purchase History
| Date | Buyer | Sale Price | Title Company |
|---|---|---|---|
| Rokaya Hari Devi | $975,000 | -- | |
| Pahari Deepak | $340,000 | -- | |
| Hicks Holding Llc | $125,000 | -- | |
| Harbin Jennifer | -- | -- | |
| Harbin Paulette G | -- | -- | |
| Harbin Warren Danny | -- | -- | |
| Harbin Julie B | -- | -- | |
| Harbin Emmitt | $25,000 | -- | |
| Lipham Harold | -- | -- | |
| Fincher Dan | -- | -- | |
| Fincher Ras Wilmier Mrs | -- | -- |
Source: Public Records
Tax History Compared to Growth
Tax History
| Year | Tax Paid | Tax Assessment Tax Assessment Total Assessment is a certain percentage of the fair market value that is determined by local assessors to be the total taxable value of land and additions on the property. | Land | Improvement |
|---|---|---|---|---|
| 2024 | $5,983 | $227,461 | $42,426 | $185,035 |
| 2023 | $4,930 | $187,004 | $42,426 | $144,578 |
| 2022 | $4,623 | $168,948 | $37,712 | $131,236 |
| 2021 | $3,791 | $158,699 | $37,712 | $120,987 |
| 2020 | $1,741 | $61,896 | $14,142 | $47,754 |
| 2019 | $1,632 | $58,867 | $14,142 | $44,725 |
| 2018 | $1,694 | $60,960 | $14,142 | $46,818 |
| 2017 | $1,727 | $62,025 | $14,142 | $47,883 |
| 2016 | $1,095 | $38,848 | $14,120 | $24,728 |
| 2015 | $1,069 | $38,848 | $14,120 | $24,728 |
| 2014 | $1,069 | $38,848 | $14,120 | $24,728 |
Source: Public Records
Map
Nearby Homes
- 104 Fincher St
- 22 River St SW
- 57 Mill St
- 0 Mill Rd Unit 10629874
- 0 Mill Rd Unit 7670319
- 8876 Cave Spring Rd SW
- 10 Ridge Rd SW
- 8876 Cave Spring
- 7 Herschel Mize Dr SW
- 7 Herschel Mize Dr
- 5677 Fosters Mill Rd SW
- 5598 Fosters Mill Rd
- 0 Melson Rd SW Unit 7676052
- 0 Melson Rd SW Unit 10636997
- 907 Gadsden Rd SW
- 424 Michael Blvd
- 123 Santa Claus Rd
- 0 McGee Bend Rd SW Unit 10351960
- 383 Valley Grove Rd
- 100 Lee Ave