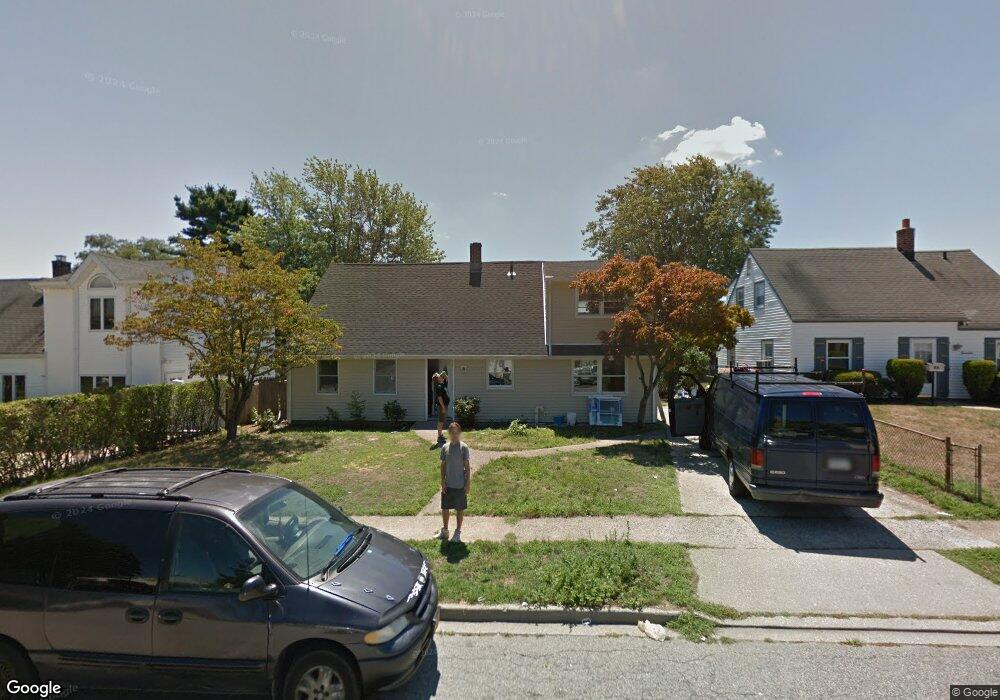
15 Rope Ln Levittown, NY 11756
Estimated Value: $741,196 - $746,000
4
Beds
2
Baths
1,922
Sq Ft
$387/Sq Ft
Est. Value
About This Home
This home is located at 15 Rope Ln, Levittown, NY 11756 and is currently estimated at $743,598, approximately $386 per square foot. 15 Rope Ln is a home located in Nassau County with nearby schools including Michael F. Stokes Elementary School, J Fred Sparke Elementary School, and Island Trees Middle School.
Ownership History
Date
Name
Owned For
Owner Type
Purchase Details
Closed on
Nov 3, 2011
Sold by
Jcd Consulting Corp
Bought by
Mohmad Ekliel and Mohmad Sarah
Current Estimated Value
Home Financials for this Owner
Home Financials are based on the most recent Mortgage that was taken out on this home.
Original Mortgage
$298,400
Outstanding Balance
$202,495
Interest Rate
3.92%
Mortgage Type
Purchase Money Mortgage
Estimated Equity
$541,103
Purchase Details
Closed on
Jun 23, 2011
Sold by
Desa Michael L and Desa Robert N
Bought by
Jcd Consulting Corp
Purchase Details
Closed on
Apr 9, 1999
Create a Home Valuation Report for This Property
The Home Valuation Report is an in-depth analysis detailing your home's value as well as a comparison with similar homes in the area
Home Values in the Area
Average Home Value in this Area
Purchase History
| Date | Buyer | Sale Price | Title Company |
|---|---|---|---|
| Mohmad Ekliel | $373,000 | -- | |
| Jcd Consulting Corp | $270,000 | -- | |
| -- | -- | -- |
Source: Public Records
Mortgage History
| Date | Status | Borrower | Loan Amount |
|---|---|---|---|
| Open | Mohmad Ekliel | $298,400 |
Source: Public Records
Tax History Compared to Growth
Tax History
| Year | Tax Paid | Tax Assessment Tax Assessment Total Assessment is a certain percentage of the fair market value that is determined by local assessors to be the total taxable value of land and additions on the property. | Land | Improvement |
|---|---|---|---|---|
| 2025 | $10,454 | $459 | $236 | $223 |
| 2024 | $3,876 | $476 | $245 | $231 |
| 2023 | $9,946 | $490 | $252 | $238 |
| 2022 | $9,946 | $490 | $252 | $238 |
| 2021 | $12,757 | $467 | $240 | $227 |
| 2020 | $8,919 | $544 | $543 | $1 |
| 2019 | $7,929 | $544 | $543 | $1 |
| 2018 | $7,470 | $581 | $0 | $0 |
| 2017 | $4,523 | $617 | $593 | $24 |
| 2016 | $7,656 | $654 | $453 | $201 |
| 2015 | $3,232 | $690 | $478 | $212 |
| 2014 | $3,232 | $690 | $478 | $212 |
| 2013 | $3,911 | $908 | $629 | $279 |
Source: Public Records
Map
Nearby Homes