Estimated Value: $1,204,092 - $1,576,000
5
Beds
4
Baths
3,381
Sq Ft
$411/Sq Ft
Est. Value
About This Home
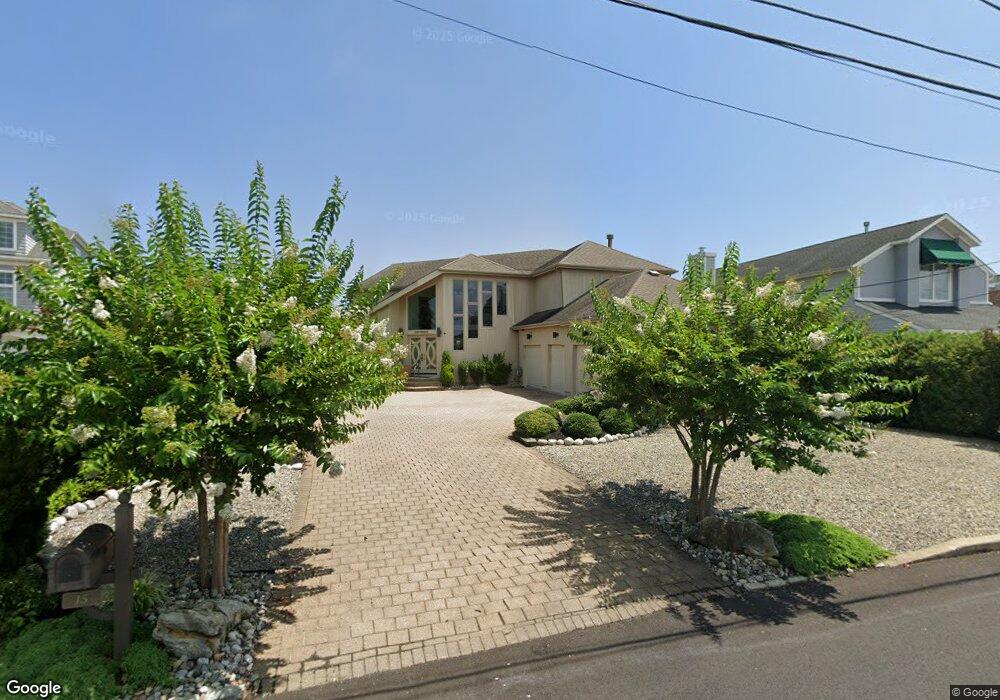
This home is located at 15 Royal Dr, Brick, NJ 08723 and is currently estimated at $1,388,773, approximately $410 per square foot. 15 Royal Dr is a home located in Ocean County with nearby schools including Drum Point Road Elementary School, Lake Riviera Middle School, and Brick Township High School.
Ownership History
Date
Name
Owned For
Owner Type
Purchase Details
Closed on
Apr 20, 2018
Sold by
Mcpeek Kenneth and Mcpeek Anna M
Bought by
Goldberger Blima and Katz Joseph Y
Current Estimated Value
Home Financials for this Owner
Home Financials are based on the most recent Mortgage that was taken out on this home.
Original Mortgage
$450,000
Outstanding Balance
$387,262
Interest Rate
4.47%
Estimated Equity
$1,001,511
Purchase Details
Closed on
Feb 25, 2008
Sold by
Buttino Anthony R and Buttino Margaret A
Bought by
Buttino Anthony R and Buttino Margaret A
Create a Home Valuation Report for This Property
The Home Valuation Report is an in-depth analysis detailing your home's value as well as a comparison with similar homes in the area
Home Values in the Area
Average Home Value in this Area
Purchase History
| Date | Buyer | Sale Price | Title Company |
|---|---|---|---|
| Goldberger Blima | $505,000 | -- | |
| Buttino Anthony R | -- | None Available |
Source: Public Records
Mortgage History
| Date | Status | Borrower | Loan Amount |
|---|---|---|---|
| Open | Goldberger Blima | $450,000 | |
| Closed | Goldberger Blima | -- |
Source: Public Records
Tax History
| Year | Tax Paid | Tax Assessment Tax Assessment Total Assessment is a certain percentage of the fair market value that is determined by local assessors to be the total taxable value of land and additions on the property. | Land | Improvement |
|---|---|---|---|---|
| 2025 | $18,071 | $699,600 | $298,000 | $401,600 |
| 2024 | $17,175 | $699,600 | $298,000 | $401,600 |
Source: Public Records
Map
Nearby Homes
Your Personal Tour Guide
Ask me questions while you tour the home.