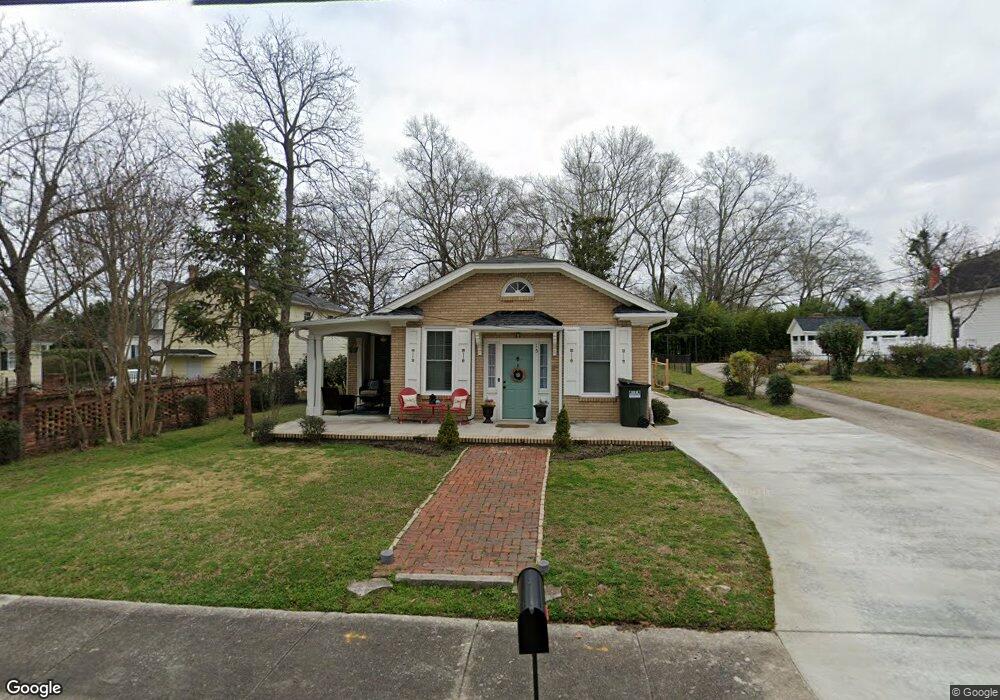
15 S Tusten St Elberton, GA 30635
Estimated Value: $177,893 - $218,000
--
Bed
1
Bath
1,566
Sq Ft
$124/Sq Ft
Est. Value
About This Home
This home is located at 15 S Tusten St, Elberton, GA 30635 and is currently estimated at $193,723, approximately $123 per square foot. 15 S Tusten St is a home located in Elbert County with nearby schools including Elbert County Primary School, Elbert County Elementary School, and Elbert County Middle School.
Ownership History
Date
Name
Owned For
Owner Type
Purchase Details
Closed on
Mar 13, 2023
Sold by
Cox Richard H
Bought by
Gunter Gregory A and Gunter Joann T
Current Estimated Value
Purchase Details
Closed on
Nov 12, 2019
Sold by
Anderson Phyllis Katrina
Bought by
Cox Richard Henry and Cox Memrie Elaine
Home Financials for this Owner
Home Financials are based on the most recent Mortgage that was taken out on this home.
Original Mortgage
$137,304
Interest Rate
4.12%
Mortgage Type
FHA
Purchase Details
Closed on
Nov 24, 2006
Sold by
Sorrells James C
Bought by
Anderson Phullis Katrina
Purchase Details
Closed on
Feb 12, 1999
Bought by
Sorrells James C and Sorrells E
Purchase Details
Closed on
Oct 1, 1995
Purchase Details
Closed on
Jun 1, 1992
Purchase Details
Closed on
Aug 1, 1989
Purchase Details
Closed on
Jul 1, 1970
Purchase Details
Closed on
Jan 1, 1970
Create a Home Valuation Report for This Property
The Home Valuation Report is an in-depth analysis detailing your home's value as well as a comparison with similar homes in the area
Home Values in the Area
Average Home Value in this Area
Purchase History
| Date | Buyer | Sale Price | Title Company |
|---|---|---|---|
| Gunter Gregory A | $167,500 | -- | |
| Cox Richard Henry | $102,500 | -- | |
| Anderson Phullis Katrina | $69,500 | -- | |
| Sorrells James C | $55,000 | -- | |
| -- | $46,000 | -- | |
| -- | $37,500 | -- | |
| -- | $37,500 | -- | |
| -- | -- | -- | |
| -- | $12,500 | -- |
Source: Public Records
Mortgage History
| Date | Status | Borrower | Loan Amount |
|---|---|---|---|
| Previous Owner | Cox Richard Henry | $137,304 |
Source: Public Records
Tax History Compared to Growth
Tax History
| Year | Tax Paid | Tax Assessment Tax Assessment Total Assessment is a certain percentage of the fair market value that is determined by local assessors to be the total taxable value of land and additions on the property. | Land | Improvement |
|---|---|---|---|---|
| 2024 | $1,645 | $66,858 | $3,859 | $62,999 |
| 2023 | $1,645 | $66,858 | $3,859 | $62,999 |
| 2022 | $1,121 | $45,571 | $3,859 | $41,712 |
| 2021 | $1,130 | $45,571 | $3,859 | $41,712 |
| 2020 | $923 | $33,467 | $3,859 | $29,608 |
| 2019 | $953 | $33,467 | $3,859 | $29,608 |
| 2018 | $974 | $33,467 | $3,859 | $29,608 |
| 2017 | $976 | $31,072 | $3,859 | $27,213 |
| 2016 | $912 | $31,072 | $3,859 | $27,213 |
| 2015 | -- | $31,072 | $3,859 | $27,213 |
| 2014 | -- | $31,072 | $3,859 | $27,213 |
| 2013 | -- | $27,752 | $3,859 | $23,893 |
Source: Public Records
Map
Nearby Homes
- 120 S Tusten St
- 245 Edwards St
- 105 S Thomas St
- 252 Edwards St
- 135 Brookside Dr
- 214 Campbell St
- 968 Ext Elbert St
- 173 Brookside Dr
- 2790 Cedar Creek Rd
- 181 Brookside Dr
- 196 S Oliver St
- 62 Oak St
- 89 College Ave
- 118 Oak Dr
- 0 Oak Dr Unit 7643600
- 0 Oak Dr Unit 10598083
- 108 Brookhaven Cir
- 141 Wildwood Dr
- 346 N Oliver St
- 136 Forest Ave
- 21 S Tusten St
- 302 Heard St
- 310 Heard St
- 16 S Tusten St
- 18 S Tusten St
- 29 S Tusten St
- 318 Heard St
- 311 E Church St
- 307 E Church St
- 265 E Church St
- 0 Heard St Unit 8056422
- 0 Heard St Unit 9012702
- 0 Heard St Unit 20000183
- 0 Heard St
- 313 E Church St
- 259 E Church St
- 305 Heard St
- 103 S Tusten St
- 326 Heard St
- 324 E Church St