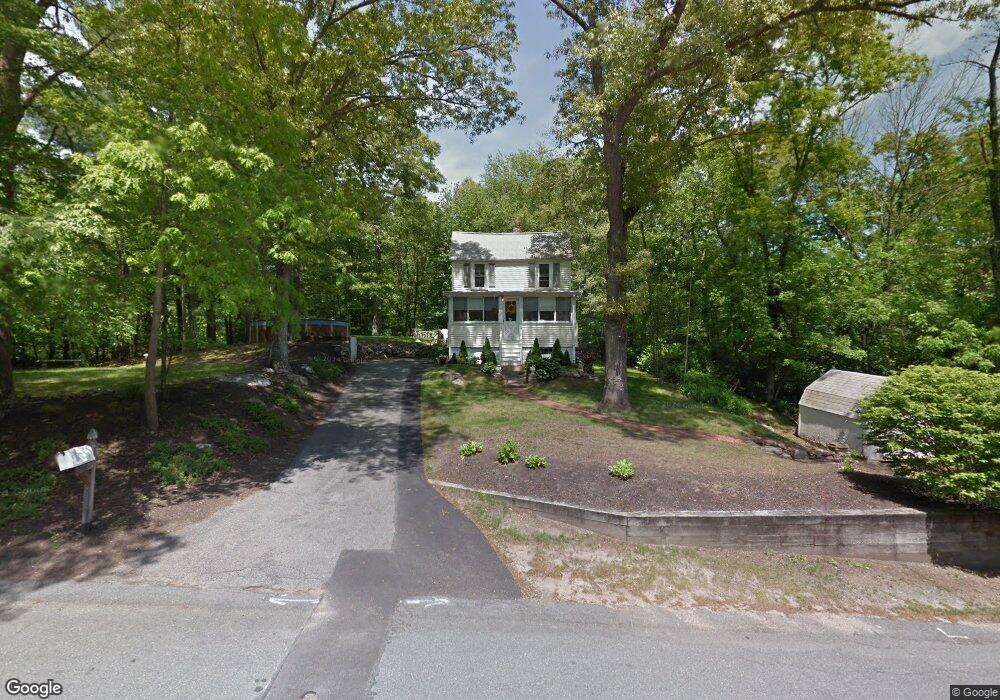
15 Samoset St South Weymouth, MA 02190
South Weymouth NeighborhoodEstimated Value: $572,000 - $650,000
3
Beds
1
Bath
1,080
Sq Ft
$558/Sq Ft
Est. Value
About This Home
This home is located at 15 Samoset St, South Weymouth, MA 02190 and is currently estimated at $602,356, approximately $557 per square foot. 15 Samoset St is a home located in Norfolk County with nearby schools including Thomas V Nash, Abigail Adams Middle School, and Weymouth Middle School Chapman.
Ownership History
Date
Name
Owned For
Owner Type
Purchase Details
Closed on
Feb 26, 1998
Sold by
Dahill James F
Bought by
Croke Dennis A and Croke Maryann
Current Estimated Value
Home Financials for this Owner
Home Financials are based on the most recent Mortgage that was taken out on this home.
Original Mortgage
$130,000
Interest Rate
6.85%
Mortgage Type
Purchase Money Mortgage
Create a Home Valuation Report for This Property
The Home Valuation Report is an in-depth analysis detailing your home's value as well as a comparison with similar homes in the area
Home Values in the Area
Average Home Value in this Area
Purchase History
| Date | Buyer | Sale Price | Title Company |
|---|---|---|---|
| Croke Dennis A | $162,500 | -- |
Source: Public Records
Mortgage History
| Date | Status | Borrower | Loan Amount |
|---|---|---|---|
| Open | Croke Dennis A | $168,000 | |
| Closed | Croke Dennis A | $123,900 | |
| Closed | Croke Dennis A | $50,000 | |
| Closed | Croke Dennis A | $130,000 |
Source: Public Records
Tax History Compared to Growth
Tax History
| Year | Tax Paid | Tax Assessment Tax Assessment Total Assessment is a certain percentage of the fair market value that is determined by local assessors to be the total taxable value of land and additions on the property. | Land | Improvement |
|---|---|---|---|---|
| 2025 | $4,617 | $457,100 | $228,500 | $228,600 |
| 2024 | $4,683 | $456,000 | $217,700 | $238,300 |
| 2023 | $4,721 | $451,800 | $221,700 | $230,100 |
| 2022 | $4,628 | $403,800 | $205,300 | $198,500 |
| 2021 | $4,294 | $365,800 | $205,300 | $160,500 |
| 2020 | $4,114 | $345,100 | $205,300 | $139,800 |
| 2019 | $4,232 | $349,200 | $215,300 | $133,900 |
| 2018 | $4,115 | $329,200 | $205,100 | $124,100 |
| 2017 | $3,951 | $308,400 | $195,300 | $113,100 |
| 2016 | $3,796 | $296,600 | $187,800 | $108,800 |
| 2015 | $3,700 | $286,800 | $187,800 | $99,000 |
| 2014 | $3,546 | $266,600 | $174,800 | $91,800 |
Source: Public Records
Map
Nearby Homes
- 68 Massapoag St Unit 7
- 24 Fisher Rd
- 16 Jay Rd
- 354 Tilden Commons Ln
- 308 Forest St
- 211 Randolph St
- 193 Randolph St
- 175 Tyson Commons Ln
- 134 Tyson Commons Ln
- 120 Randolph St
- 30 Bradford Commons Ln
- 92 Mercury St
- 50 Hollis St
- 262 West St
- 255 West St
- 27 Park Ave
- 655 Summer St
- 18 Fountain Ln Unit 2
- 2 Mitchell Ln Unit B
- 441 Grove St