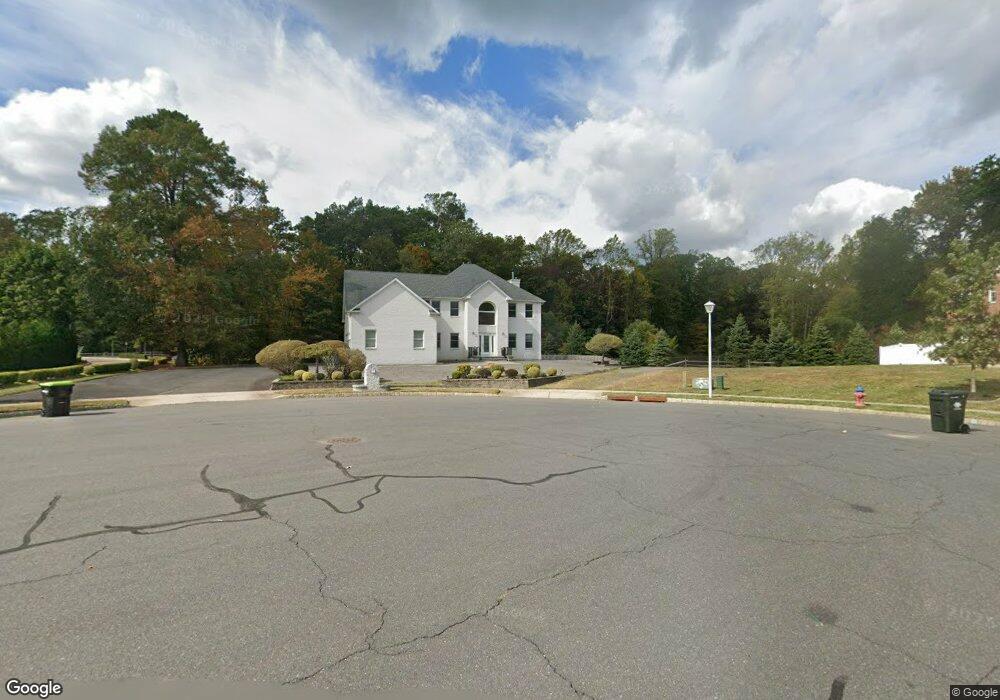
15 San Diego Ct Old Bridge, NJ 08857
Estimated Value: $1,133,655 - $1,217,000
--
Bed
--
Bath
3,486
Sq Ft
$340/Sq Ft
Est. Value
About This Home
This home is located at 15 San Diego Ct, Old Bridge, NJ 08857 and is currently estimated at $1,186,164, approximately $340 per square foot. 15 San Diego Ct is a home with nearby schools including Old Bridge High School and Heroes Academy.
Ownership History
Date
Name
Owned For
Owner Type
Purchase Details
Closed on
Dec 21, 2016
Sold by
Nguyen Minh
Bought by
Abramson Dmitry and Abramson Amrina
Current Estimated Value
Home Financials for this Owner
Home Financials are based on the most recent Mortgage that was taken out on this home.
Original Mortgage
$200,000
Outstanding Balance
$159,470
Interest Rate
3.12%
Mortgage Type
Adjustable Rate Mortgage/ARM
Estimated Equity
$1,026,694
Purchase Details
Closed on
Dec 15, 2011
Sold by
Le Hanh
Bought by
Nguyen John T
Home Financials for this Owner
Home Financials are based on the most recent Mortgage that was taken out on this home.
Original Mortgage
$360,000
Interest Rate
2.5%
Mortgage Type
Adjustable Rate Mortgage/ARM
Purchase Details
Closed on
Oct 31, 2011
Sold by
Woodhaven Village Inc
Bought by
Nguyen John T
Home Financials for this Owner
Home Financials are based on the most recent Mortgage that was taken out on this home.
Original Mortgage
$360,000
Interest Rate
2.5%
Mortgage Type
Adjustable Rate Mortgage/ARM
Create a Home Valuation Report for This Property
The Home Valuation Report is an in-depth analysis detailing your home's value as well as a comparison with similar homes in the area
Home Values in the Area
Average Home Value in this Area
Purchase History
| Date | Buyer | Sale Price | Title Company |
|---|---|---|---|
| Abramson Dmitry | $585,000 | None Available | |
| Nguyen John T | -- | Chicago Title Insurance Co | |
| Nguyen John T | $623,650 | Professional Abstract & Titl |
Source: Public Records
Mortgage History
| Date | Status | Borrower | Loan Amount |
|---|---|---|---|
| Open | Abramson Dmitry | $200,000 | |
| Previous Owner | Nguyen John T | $360,000 |
Source: Public Records
Tax History Compared to Growth
Tax History
| Year | Tax Paid | Tax Assessment Tax Assessment Total Assessment is a certain percentage of the fair market value that is determined by local assessors to be the total taxable value of land and additions on the property. | Land | Improvement |
|---|---|---|---|---|
| 2025 | $17,839 | $315,900 | $99,000 | $216,900 |
| 2024 | $17,112 | $315,900 | $99,000 | $216,900 |
| 2023 | $17,112 | $315,900 | $99,000 | $216,900 |
| 2022 | $16,721 | $315,900 | $99,000 | $216,900 |
| 2021 | $12,299 | $316,600 | $99,000 | $217,600 |
| 2020 | $16,264 | $316,600 | $99,000 | $217,600 |
| 2019 | $15,988 | $316,600 | $99,000 | $217,600 |
| 2018 | $15,811 | $316,600 | $99,000 | $217,600 |
| 2017 | $15,298 | $316,600 | $99,000 | $217,600 |
| 2016 | $14,982 | $316,600 | $99,000 | $217,600 |
| 2015 | $14,722 | $316,600 | $99,000 | $217,600 |
| 2014 | $14,573 | $316,600 | $99,000 | $217,600 |
Source: Public Records
Map
Nearby Homes
- 19 Helene St
- 22 Forest Ln
- 13 Stonegate Dr
- 312 Matchaponix Rd
- 26 Cannon Rd
- 303 Matchaponix Rd
- 2 Legends Dr
- 372 Matchaponix Rd
- 0-0 Spotswood Englishtown Rd
- 0 Spotswood Englishtown Rd
- 14 Edward Ave
- 4 Texas Rd
- 2 Guinevere Rd
- 11 Gloria Ln
- 157 Valentino Dr
- 11 Galerie Ct
- 41 10th Ave
- 165 Valentino Dr
- 167 Valentino Dr
- 415 Spotswood Englishtown Rd