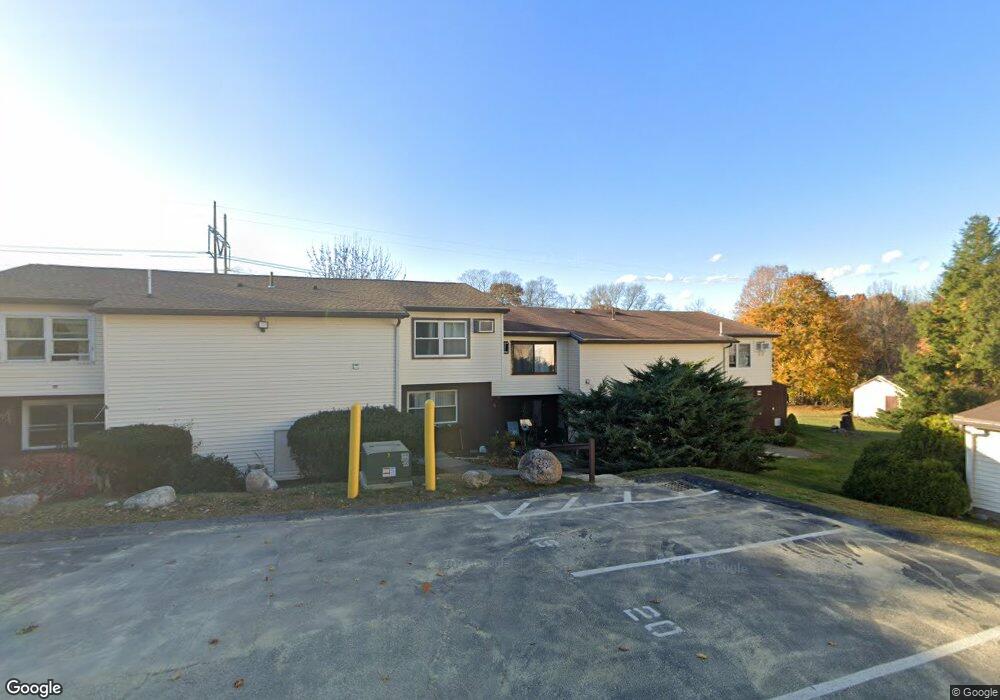
15 Senee Ct Amesbury, MA 01913
Estimated Value: $322,000 - $344,000
3
Beds
2
Baths
1,190
Sq Ft
$280/Sq Ft
Est. Value
About This Home
This home is located at 15 Senee Ct, Amesbury, MA 01913 and is currently estimated at $333,714, approximately $280 per square foot. 15 Senee Ct is a home located in Essex County with nearby schools including Amesbury High School and Amesbury Seventh-Day Adventist School.
Ownership History
Date
Name
Owned For
Owner Type
Purchase Details
Closed on
Dec 4, 2024
Sold by
Fontaine Charlene N
Bought by
Maguire Daniel A
Current Estimated Value
Home Financials for this Owner
Home Financials are based on the most recent Mortgage that was taken out on this home.
Original Mortgage
$183,000
Outstanding Balance
$180,795
Interest Rate
6.54%
Mortgage Type
Purchase Money Mortgage
Estimated Equity
$152,919
Purchase Details
Closed on
Sep 2, 2016
Sold by
Simpson Sheena and Puddu Andrea
Bought by
Nader-Fontaine Charlene
Purchase Details
Closed on
Jan 31, 2008
Sold by
Brooks Jennifer L
Bought by
Simpson Sheena and Puddu Andrea
Home Financials for this Owner
Home Financials are based on the most recent Mortgage that was taken out on this home.
Original Mortgage
$155,700
Interest Rate
6.18%
Mortgage Type
Purchase Money Mortgage
Purchase Details
Closed on
Nov 7, 2002
Sold by
Collier Sharla
Bought by
Brooks Jennifer L
Purchase Details
Closed on
Aug 31, 2001
Sold by
15 Senee Court Rt and Kelly Brendan
Bought by
Collier Sharla D
Purchase Details
Closed on
Mar 29, 1996
Sold by
Fnma
Bought by
Kelly Teresa F
Create a Home Valuation Report for This Property
The Home Valuation Report is an in-depth analysis detailing your home's value as well as a comparison with similar homes in the area
Home Values in the Area
Average Home Value in this Area
Purchase History
| Date | Buyer | Sale Price | Title Company |
|---|---|---|---|
| Maguire Daniel A | $305,000 | None Available | |
| Maguire Daniel A | $305,000 | None Available | |
| Nader-Fontaine Charlene | $165,000 | -- | |
| Simpson Sheena | $155,700 | -- | |
| Simpson Sheena | $155,700 | -- | |
| Brooks Jennifer L | $127,500 | -- | |
| Brooks Jennifer L | $127,500 | -- | |
| Collier Sharla D | $95,000 | -- | |
| Collier Sharla D | $95,000 | -- | |
| Kelly Teresa F | $37,500 | -- | |
| Kelly Teresa F | $37,500 | -- |
Source: Public Records
Mortgage History
| Date | Status | Borrower | Loan Amount |
|---|---|---|---|
| Open | Maguire Daniel A | $183,000 | |
| Closed | Maguire Daniel A | $183,000 | |
| Previous Owner | Kelly Teresa F | $148,300 | |
| Previous Owner | Kelly Teresa F | $155,700 |
Source: Public Records
Tax History
| Year | Tax Paid | Tax Assessment Tax Assessment Total Assessment is a certain percentage of the fair market value that is determined by local assessors to be the total taxable value of land and additions on the property. | Land | Improvement |
|---|---|---|---|---|
| 2025 | $5,288 | $345,600 | $0 | $345,600 |
| 2024 | $4,786 | $306,000 | $0 | $306,000 |
| 2023 | $4,088 | $250,200 | $0 | $250,200 |
| 2022 | $3,839 | $217,000 | $0 | $217,000 |
| 2021 | $3,426 | $187,700 | $0 | $187,700 |
| 2020 | $3,177 | $184,900 | $0 | $184,900 |
| 2019 | $3,044 | $165,700 | $0 | $165,700 |
| 2018 | $3,249 | $171,100 | $0 | $171,100 |
| 2017 | $1,776 | $89,000 | $0 | $89,000 |
| 2016 | $1,766 | $87,100 | $0 | $87,100 |
Source: Public Records
Map
Nearby Homes
- 6 Adams Ct
- 20 Mason Ct
- 14 Mason Ct Unit 14
- 25 Whittier Meadows Dr
- 48 Whittier Meadows Dr
- 7 Harrison Eaton Ln
- 48 Orchard St
- 35 Orchard St
- 1 Brown Ave Unit 1-25
- 37 Powow St
- 102R Kimball Rd
- 149 Market St
- 11 1/2 Sanborn Terrace
- 105 Market St Unit B
- 101 Market St Unit B
- 12 School St Unit 2
- 25 Cedar St Unit 7
- 4 Clark St
- 1 Hillside Ave Unit 3
- 97 Elm St
Your Personal Tour Guide
Ask me questions while you tour the home.