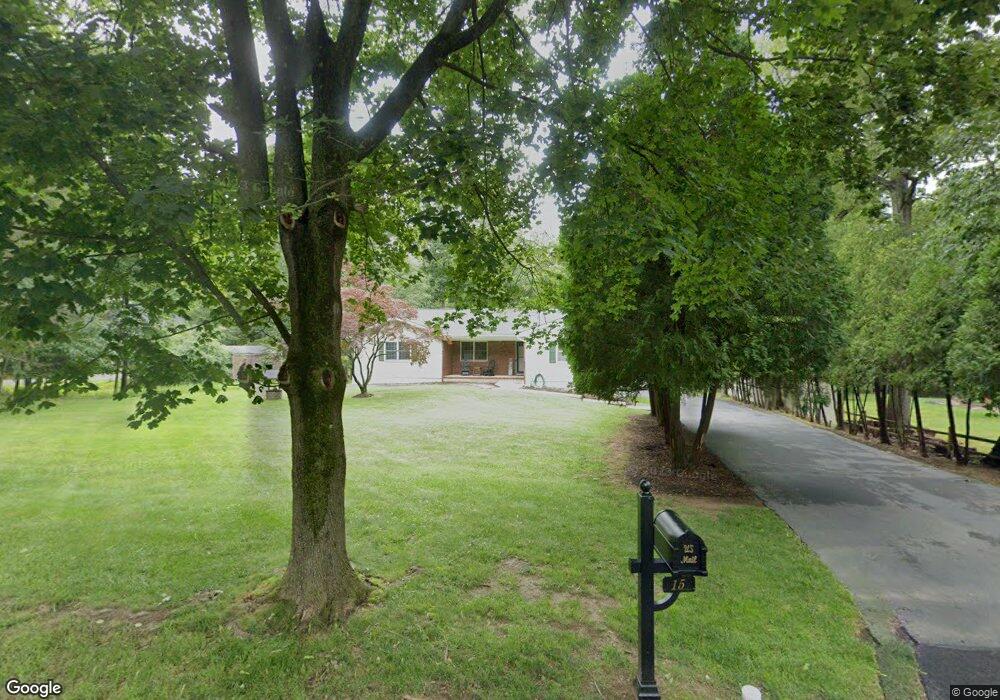
15 Shongum Rd Randolph, NJ 07869
Estimated Value: $811,000 - $846,000
--
Bed
--
Bath
2,269
Sq Ft
$364/Sq Ft
Est. Value
About This Home
This home is located at 15 Shongum Rd, Randolph, NJ 07869 and is currently estimated at $826,103, approximately $364 per square foot. 15 Shongum Rd is a home located in Morris County with nearby schools including Randolph High School, Randolph Middle School, and Apple Montessori Schools and Camps - Randolph.
Ownership History
Date
Name
Owned For
Owner Type
Purchase Details
Closed on
Jun 27, 2011
Sold by
Lam Shui Yau Stanny and Lam Yin Yuk
Bought by
Hendrickson Brian K and Hendrickson Joanna
Current Estimated Value
Home Financials for this Owner
Home Financials are based on the most recent Mortgage that was taken out on this home.
Original Mortgage
$399,606
Outstanding Balance
$278,011
Interest Rate
4.75%
Mortgage Type
FHA
Estimated Equity
$548,092
Create a Home Valuation Report for This Property
The Home Valuation Report is an in-depth analysis detailing your home's value as well as a comparison with similar homes in the area
Home Values in the Area
Average Home Value in this Area
Purchase History
| Date | Buyer | Sale Price | Title Company |
|---|---|---|---|
| Hendrickson Brian K | $410,000 | None Available |
Source: Public Records
Mortgage History
| Date | Status | Borrower | Loan Amount |
|---|---|---|---|
| Open | Hendrickson Brian K | $399,606 |
Source: Public Records
Tax History Compared to Growth
Tax History
| Year | Tax Paid | Tax Assessment Tax Assessment Total Assessment is a certain percentage of the fair market value that is determined by local assessors to be the total taxable value of land and additions on the property. | Land | Improvement |
|---|---|---|---|---|
| 2025 | $12,519 | $442,200 | $160,900 | $281,300 |
| 2024 | $12,163 | $442,200 | $160,900 | $281,300 |
| 2023 | $12,163 | $440,700 | $160,900 | $279,800 |
| 2022 | $11,687 | $440,700 | $160,900 | $279,800 |
| 2021 | $11,436 | $440,700 | $160,900 | $279,800 |
| 2020 | $11,568 | $440,700 | $160,900 | $279,800 |
| 2019 | $11,436 | $440,700 | $160,900 | $279,800 |
| 2018 | $11,291 | $440,700 | $160,900 | $279,800 |
| 2017 | $11,150 | $440,700 | $160,900 | $279,800 |
| 2016 | $9,640 | $263,400 | $118,000 | $145,400 |
| 2015 | $9,525 | $263,400 | $118,000 | $145,400 |
| 2014 | $9,377 | $263,400 | $118,000 | $145,400 |
Source: Public Records
Map
Nearby Homes
- 41 Shongum Rd
- 29 Piersons Hill Rd
- 10 Campo Rd
- 4 Waterview Ln
- 13 Holly Dr
- 66 Fords Rd
- 18 Rosewood Ln
- 44 Shongum Rd
- 10 Cambridge Ct
- 6 Quarry Ct
- 20 Longhill Rd
- 6 Knoll Top Ct
- 3 Springhill Rd
- 166 Millbrook Ave
- 189 Center Grove Rd
- 193 Center Grove Rd
- 215 Washington Ave
- 19 Lawrence Rd
- 119 Millbrook Ave
- 160 W Hanover Ave