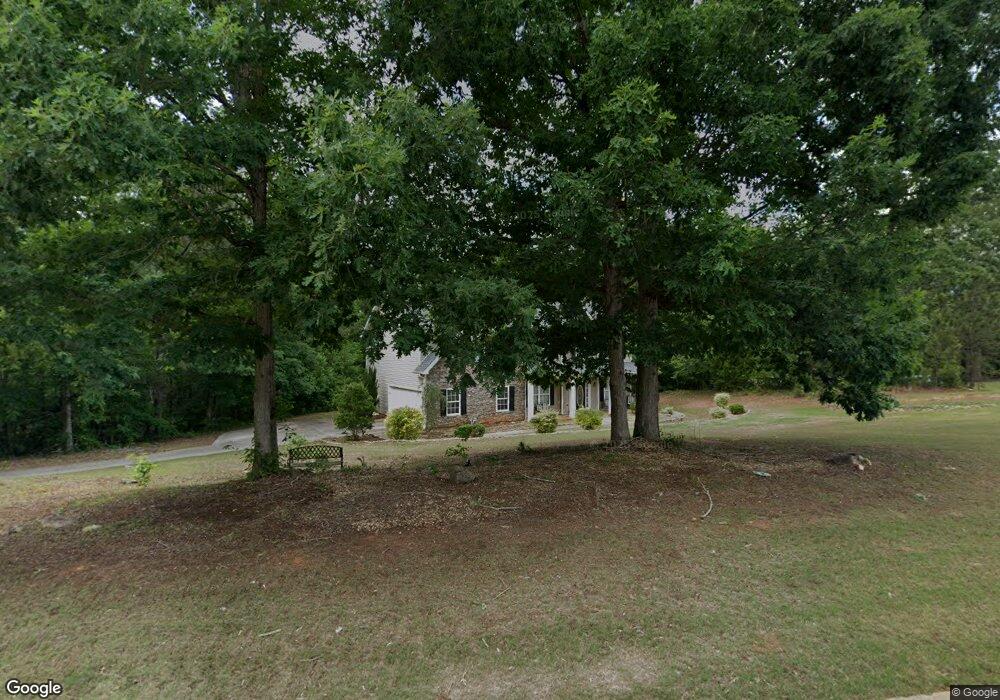
15 Smokey Ridge Ct Unit 15 Newnan, GA 30263
Estimated Value: $423,910 - $616,000
3
Beds
3
Baths
3,248
Sq Ft
$154/Sq Ft
Est. Value
About This Home
This home is located at 15 Smokey Ridge Ct Unit 15, Newnan, GA 30263 and is currently estimated at $500,228, approximately $154 per square foot. 15 Smokey Ridge Ct Unit 15 is a home located in Coweta County with nearby schools including Ruth Hill Elementary School, Smokey Road Middle School, and Newnan High School.
Ownership History
Date
Name
Owned For
Owner Type
Purchase Details
Closed on
Feb 26, 2010
Sold by
Heritage Bk
Bought by
Mcfadden Gregory A and Williams Patrice
Current Estimated Value
Home Financials for this Owner
Home Financials are based on the most recent Mortgage that was taken out on this home.
Original Mortgage
$196,377
Outstanding Balance
$130,090
Interest Rate
4.97%
Mortgage Type
FHA
Estimated Equity
$370,138
Purchase Details
Closed on
Oct 6, 2009
Sold by
Tmar Farms Llc
Bought by
Heritage Bank
Purchase Details
Closed on
Jul 24, 2009
Sold by
Tmar Farms Llc
Bought by
Heritage Bank
Purchase Details
Closed on
Jan 13, 2006
Sold by
Pettit John S
Bought by
Rb&T Development Llc
Purchase Details
Closed on
Jul 22, 2003
Sold by
April Properties Inc
Bought by
Pettit John S
Purchase Details
Closed on
Aug 13, 2002
Sold by
Odom H Parnell
Bought by
April Properties Inc
Create a Home Valuation Report for This Property
The Home Valuation Report is an in-depth analysis detailing your home's value as well as a comparison with similar homes in the area
Home Values in the Area
Average Home Value in this Area
Purchase History
| Date | Buyer | Sale Price | Title Company |
|---|---|---|---|
| Mcfadden Gregory A | $200,000 | -- | |
| Heritage Bank | $673,200 | -- | |
| Heritage Bank | -- | -- | |
| Rb&T Development Llc | $471,500 | -- | |
| Pettit John S | $417,100 | -- | |
| April Properties Inc | $182,000 | -- |
Source: Public Records
Mortgage History
| Date | Status | Borrower | Loan Amount |
|---|---|---|---|
| Open | Mcfadden Gregory A | $196,377 |
Source: Public Records
Tax History Compared to Growth
Tax History
| Year | Tax Paid | Tax Assessment Tax Assessment Total Assessment is a certain percentage of the fair market value that is determined by local assessors to be the total taxable value of land and additions on the property. | Land | Improvement |
|---|---|---|---|---|
| 2024 | $4,030 | $173,591 | $20,000 | $153,591 |
| 2023 | $4,030 | $147,800 | $20,000 | $127,800 |
| 2022 | $3,404 | $142,904 | $20,000 | $122,904 |
| 2021 | $3,176 | $125,309 | $10,000 | $115,309 |
| 2020 | $3,196 | $125,309 | $10,000 | $115,309 |
| 2019 | $3,090 | $110,391 | $8,000 | $102,391 |
| 2018 | $3,097 | $110,391 | $8,000 | $102,391 |
| 2017 | $3,096 | $110,391 | $8,000 | $102,391 |
| 2016 | $1,852 | $68,647 | $8,000 | $60,647 |
| 2015 | $1,823 | $68,647 | $8,000 | $60,647 |
| 2014 | $1,811 | $68,647 | $8,000 | $60,647 |
Source: Public Records
Map
Nearby Homes
- 713 Smokey Rd
- 623 Belk Rd
- 75 Davis McLendon Way
- 0 Meadowsweet Ln Unit 10582479
- 0 Belk Rd Unit 10545375
- 0 Smokey Rd Unit 10495165
- 51 Belk Rd
- 31 Festiva Dr
- 68 Timberland Trail
- 50 Hearthstone Dr
- 0000 Smokey Rd
- 261 Lagrange St
- 0 Wallace Gray Cir Unit 10590659
- 124 Wallace Gray Cir
- 130 Wallace Gray Cir
- 100 Cedara Dr Unit 10
- 58 Bailey Dr
- 18 Rutherford Dr Unit LOT 28
- 12 Plantation Dr
- 25 Westgate Park Dr
- 15 Smokey Ridge Ct
- 27 Smokey Ridge Ct
- 83 Smokey Ridge Dr
- 83 Smokey Ridge Dr Unit 5
- 12 Smokey Ridge Ct Unit 12
- 118 Smokey Ridge Dr
- 12 Smokey Ridge Ct
- 0 Smokey Ridge Ct Unit 22 7375942
- 4 Smokey Ridge Ct Unit A-4
- 71 Smokey Ridge Dr
- 111 Smokey Ridge Dr
- 99 Smokey Ridge Dr
- 53 Smokey Ridge Dr
- 136 Smokey Ridge Dr
- 36 Smokey Ridge Ct
- 131 Smokey Ridge Dr
- 38 Smokey Ridge Ct
- 685 Smokey Rd
- 150 Smokey Ridge Dr
- 33 Smokey Ridge Dr