Estimated Value: $423,330 - $507,000
2
Beds
2
Baths
888
Sq Ft
$511/Sq Ft
Est. Value
About This Home
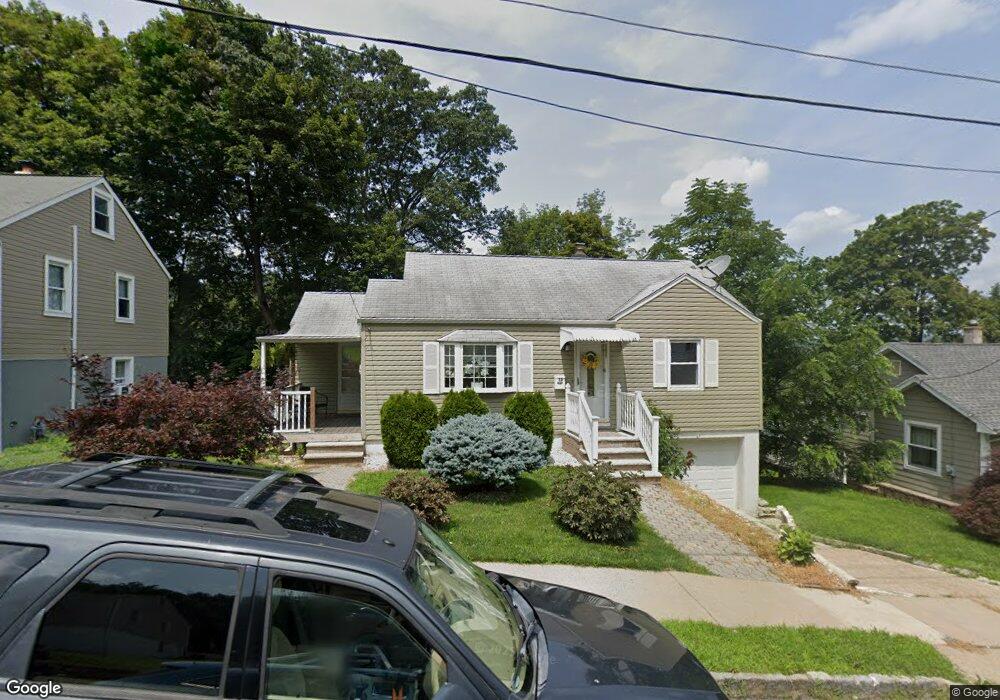
This home is located at 15 South St, Dover, NJ 07801 and is currently estimated at $453,583, approximately $510 per square foot. 15 South St is a home located in Morris County with nearby schools including Dover Middle School and Dover High School.
Ownership History
Date
Name
Owned For
Owner Type
Purchase Details
Closed on
Apr 17, 2008
Sold by
Medina Margarita M and Medina Jairo
Bought by
Medina Margarita M and Medina Jairo
Current Estimated Value
Home Financials for this Owner
Home Financials are based on the most recent Mortgage that was taken out on this home.
Original Mortgage
$203,863
Interest Rate
5.48%
Mortgage Type
New Conventional
Purchase Details
Closed on
Dec 18, 2003
Sold by
Kuzma Amelia
Bought by
Medina Margarita
Home Financials for this Owner
Home Financials are based on the most recent Mortgage that was taken out on this home.
Original Mortgage
$199,500
Interest Rate
5.88%
Create a Home Valuation Report for This Property
The Home Valuation Report is an in-depth analysis detailing your home's value as well as a comparison with similar homes in the area
Home Values in the Area
Average Home Value in this Area
Purchase History
| Date | Buyer | Sale Price | Title Company |
|---|---|---|---|
| Medina Margarita M | -- | Service Link | |
| Medina Margarita | $210,000 | -- |
Source: Public Records
Mortgage History
| Date | Status | Borrower | Loan Amount |
|---|---|---|---|
| Closed | Medina Margarita M | $203,863 | |
| Closed | Medina Margarita | $199,500 |
Source: Public Records
Tax History
| Year | Tax Paid | Tax Assessment Tax Assessment Total Assessment is a certain percentage of the fair market value that is determined by local assessors to be the total taxable value of land and additions on the property. | Land | Improvement |
|---|---|---|---|---|
| 2025 | $6,589 | $201,300 | $91,200 | $110,100 |
| 2024 | $6,355 | $201,300 | $91,200 | $110,100 |
Source: Public Records
Map
Nearby Homes
- 37 Kearney St
- 121 W Munson Ave
- 5 A&B Dewey St
- 3 Marble Ln
- 142 W Blackwell St
- 170 Park Heights Ave
- 121 W Clinton St
- 12 Lincoln Ave
- 179 Pequannock St
- 8 N Elk Ave
- 14 Jessica Ln
- 13 James St
- 417 W Black Well St Ab
- 107 High St
- 77B Highland Way
- 36 Kitchell Ave
- 174 Baker Ave
- 343 & 339 Quaker Church Rd
- 71 Washington Ave Unit 73
- 301 E McFarlan St -A and B
Your Personal Tour Guide
Ask me questions while you tour the home.