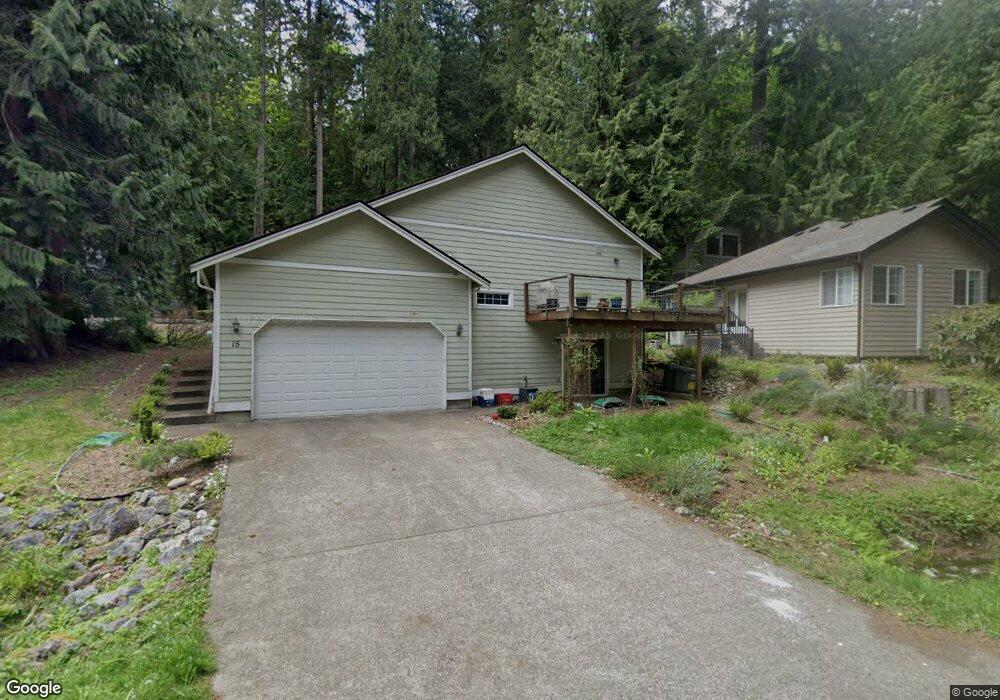
15 Spring Rd Bellingham, WA 98229
Estimated Value: $507,000 - $628,000
3
Beds
2
Baths
1,969
Sq Ft
$284/Sq Ft
Est. Value
About This Home
This home is located at 15 Spring Rd, Bellingham, WA 98229 and is currently estimated at $559,774, approximately $284 per square foot. 15 Spring Rd is a home located in Whatcom County with nearby schools including Geneva Elementary School, Kulshan Middle School, and Bellingham High School.
Ownership History
Date
Name
Owned For
Owner Type
Purchase Details
Closed on
May 5, 2021
Sold by
Homel Daniel and Homel Janet
Bought by
Homel Joseph and Homel Nilliet
Current Estimated Value
Purchase Details
Closed on
Apr 4, 2016
Sold by
Famil Leonard and Famil Margaret Homel Revocable
Bought by
Homel Daniel and Homel Janet
Purchase Details
Closed on
Jun 18, 2015
Sold by
Homel Daniel and Homel Janet
Bought by
Homel Leonard
Purchase Details
Closed on
Apr 17, 2012
Sold by
Thompson Duane W and Thompson Judith M
Bought by
Homel Daniel B and Homel Janet O
Home Financials for this Owner
Home Financials are based on the most recent Mortgage that was taken out on this home.
Original Mortgage
$181,295
Interest Rate
3.9%
Mortgage Type
FHA
Create a Home Valuation Report for This Property
The Home Valuation Report is an in-depth analysis detailing your home's value as well as a comparison with similar homes in the area
Home Values in the Area
Average Home Value in this Area
Purchase History
| Date | Buyer | Sale Price | Title Company |
|---|---|---|---|
| Homel Joseph | $400,000 | Chicago Title Bellingham | |
| Homel Daniel | -- | None Available | |
| Homel Leonard | $245,000 | Chicago Title Insurance | |
| Homel Daniel B | $199,780 | First American Title Ins |
Source: Public Records
Mortgage History
| Date | Status | Borrower | Loan Amount |
|---|---|---|---|
| Previous Owner | Homel Daniel B | $181,295 |
Source: Public Records
Tax History Compared to Growth
Tax History
| Year | Tax Paid | Tax Assessment Tax Assessment Total Assessment is a certain percentage of the fair market value that is determined by local assessors to be the total taxable value of land and additions on the property. | Land | Improvement |
|---|---|---|---|---|
| 2024 | $4,635 | $532,347 | $134,920 | $397,427 |
| 2023 | $4,635 | $535,598 | $135,744 | $399,854 |
| 2022 | $3,689 | $461,736 | $117,024 | $344,712 |
| 2021 | $3,537 | $334,591 | $84,800 | $249,791 |
| 2020 | $3,549 | $315,652 | $80,000 | $235,652 |
| 2019 | $3,253 | $313,952 | $69,044 | $244,908 |
| 2018 | $3,263 | $294,788 | $64,800 | $229,988 |
| 2017 | $2,756 | $251,920 | $55,350 | $196,570 |
| 2016 | $2,469 | $221,636 | $48,600 | $173,036 |
| 2015 | $2,473 | $207,828 | $46,323 | $161,505 |
| 2014 | -- | $201,892 | $45,000 | $156,892 |
| 2013 | -- | $205,931 | $65,700 | $140,231 |
Source: Public Records
Map
Nearby Homes
- 434 Sudden Valley Dr
- 19 Valley Crest Way
- 422 Sudden Valley Dr
- 3 Acorn Place
- 1 Valley Crest Way
- 63 Valley Crest Way
- 2 Marigold Dr Unit 26
- 2 Marigold Dr Unit 36
- 43 Rocky Ridge Dr
- 15 Wintercress Way
- 1 Lake Louise Dr Unit 42
- 6 Lake Louise Dr
- 9 Marigold Dr
- 9 Grand View Ln
- 63 Louise View Dr
- 1 Morning Beach Dr Unit 38
- 28 Grand View Ln
- 22 Marigold Dr Unit 34
- 22 Marigold Dr Unit 45
- 337 Sudden Valley Dr
- 13 Spring Rd
- 11 Spring Rd
- 9 Spring Rd
- 19 Spring Rd
- 31 Spring Rd
- 29 Spring Rd
- 7 Spring Ct
- 7 Spring Rd
- 27 Spring Rd
- 25 Spring Rd
- 439 Sudden Valley Dr
- 7 D Spring Ct
- 427 Sudden Valley Dr
- 432 Sudden Valley Dr
- 1991 Lake Whatcom Blvd
- 443 Sudden Valley Dr
- 425 Sudden Valley Dr
- 438 Sudden Valley Dr
- 21 Valley Crest Way