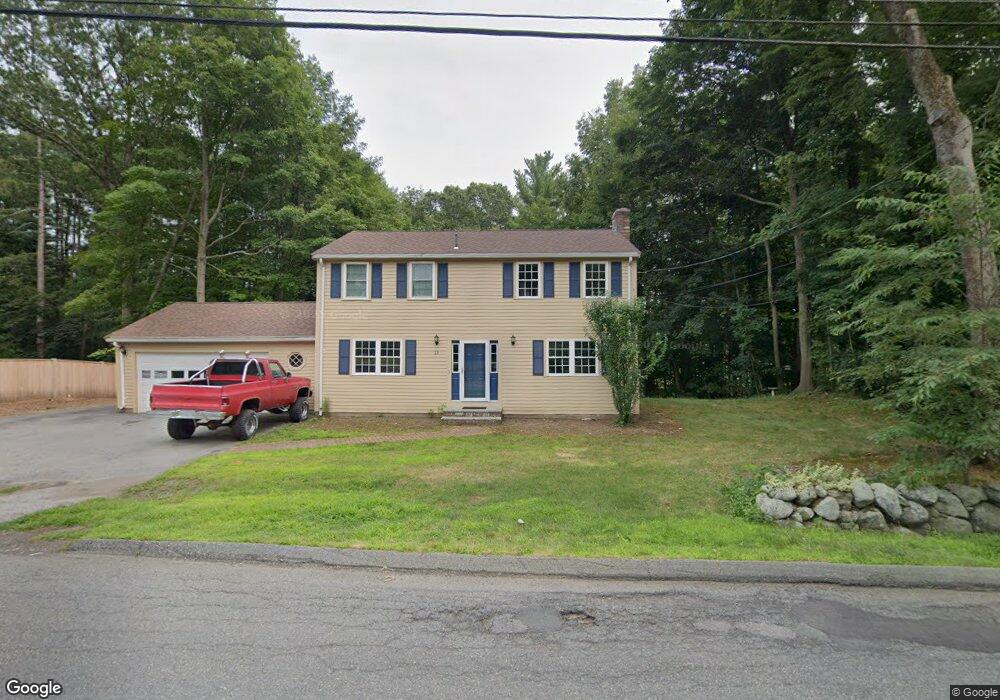
15 Spring St Danvers, MA 01923
Estimated Value: $794,093 - $1,210,000
4
Beds
3
Baths
1,700
Sq Ft
$536/Sq Ft
Est. Value
About This Home
This home is located at 15 Spring St, Danvers, MA 01923 and is currently estimated at $911,023, approximately $535 per square foot. 15 Spring St is a home located in Essex County with nearby schools including Danvers High School, St. Mary of the Annunciation School, and St. John's Prep.
Ownership History
Date
Name
Owned For
Owner Type
Purchase Details
Closed on
Mar 28, 1997
Sold by
Goldberg Louis M
Bought by
Makarewicz Conrad
Current Estimated Value
Purchase Details
Closed on
Mar 1, 1996
Sold by
Dorion Robert H and Dorion Judith
Bought by
Goldberg Louis M
Purchase Details
Closed on
Nov 18, 1988
Sold by
Mansfiel Clarence E
Bought by
Dorion Robert H
Create a Home Valuation Report for This Property
The Home Valuation Report is an in-depth analysis detailing your home's value as well as a comparison with similar homes in the area
Home Values in the Area
Average Home Value in this Area
Purchase History
| Date | Buyer | Sale Price | Title Company |
|---|---|---|---|
| Makarewicz Conrad | $240,000 | -- | |
| Goldberg Louis M | $219,000 | -- | |
| Dorion Robert H | $253,900 | -- |
Source: Public Records
Mortgage History
| Date | Status | Borrower | Loan Amount |
|---|---|---|---|
| Open | Dorion Robert H | $332,000 | |
| Closed | Dorion Robert H | $338,295 |
Source: Public Records
Tax History
| Year | Tax Paid | Tax Assessment Tax Assessment Total Assessment is a certain percentage of the fair market value that is determined by local assessors to be the total taxable value of land and additions on the property. | Land | Improvement |
|---|---|---|---|---|
| 2025 | $7,374 | $671,000 | $388,600 | $282,400 |
| 2024 | $7,320 | $658,900 | $388,600 | $270,300 |
| 2023 | $7,042 | $599,300 | $353,200 | $246,100 |
| 2022 | $6,953 | $549,200 | $320,800 | $228,400 |
| 2021 | $6,734 | $504,400 | $304,000 | $200,400 |
| 2020 | $6,654 | $509,500 | $300,500 | $209,000 |
| 2019 | $6,252 | $470,800 | $273,500 | $197,300 |
| 2018 | $6,144 | $453,800 | $270,800 | $183,000 |
| 2017 | $5,784 | $407,600 | $237,100 | $170,500 |
| 2016 | $5,568 | $392,100 | $226,300 | $165,800 |
| 2015 | $5,357 | $359,300 | $206,000 | $153,300 |
Source: Public Records
Map
Nearby Homes
- 26 Ledgewood Dr
- 320 Newbury St Unit 704
- 7 Paulette Dr
- 78 North St
- 513 Maple St
- 22 Maple Ave
- 35 Locust St Unit 3
- 43 Hobart St Unit B
- 12 Chestnut St
- 14 Williams St Unit C17
- 18 Wadsworth St
- 2 Chapel Rd
- 22 Braman St
- 200 North St Unit 31A
- 200 North St Unit 23-B
- 103 Newbury St Unit 1
- 10 Cottage Ave
- 466 Newbury St Unit 20
- 20 Central Ave
- 98 Newbury St Unit 18B
Your Personal Tour Guide
Ask me questions while you tour the home.