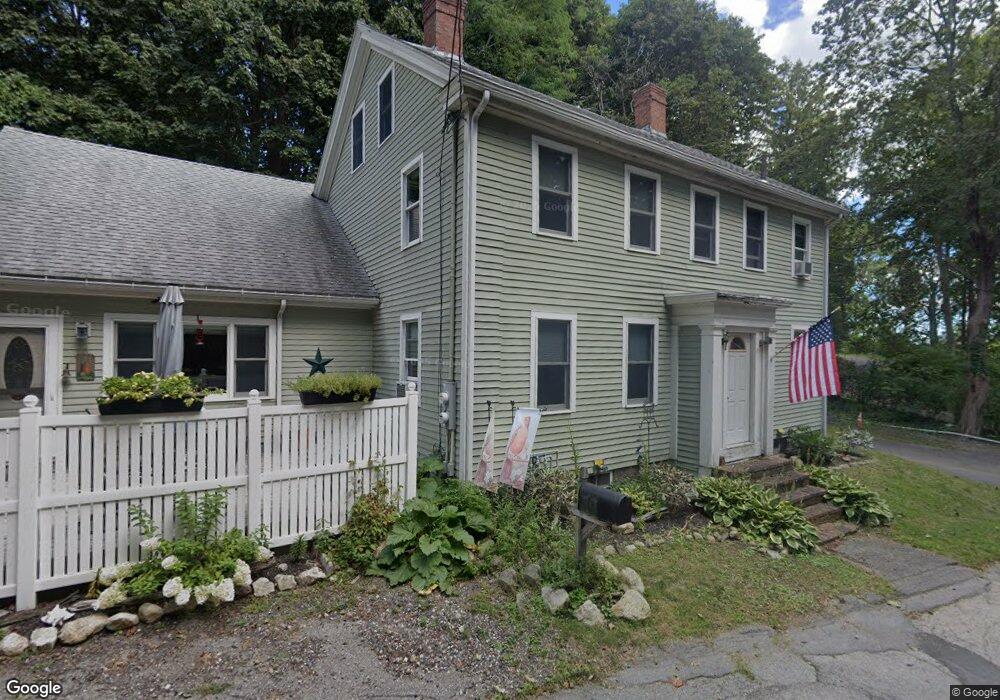
15 Spring St Ipswich, MA 01938
Estimated Value: $685,150 - $1,001,000
7
Beds
5
Baths
3,330
Sq Ft
$253/Sq Ft
Est. Value
About This Home
This home is located at 15 Spring St, Ipswich, MA 01938 and is currently estimated at $842,288, approximately $252 per square foot. 15 Spring St is a home located in Essex County with nearby schools including Ipswich High School and North Shore Montessori School.
Ownership History
Date
Name
Owned For
Owner Type
Purchase Details
Closed on
May 9, 1997
Sold by
Hetnar Ruth L
Bought by
Robins Mark W
Current Estimated Value
Home Financials for this Owner
Home Financials are based on the most recent Mortgage that was taken out on this home.
Original Mortgage
$135,000
Outstanding Balance
$18,298
Interest Rate
7.88%
Mortgage Type
Purchase Money Mortgage
Estimated Equity
$823,990
Create a Home Valuation Report for This Property
The Home Valuation Report is an in-depth analysis detailing your home's value as well as a comparison with similar homes in the area
Home Values in the Area
Average Home Value in this Area
Purchase History
| Date | Buyer | Sale Price | Title Company |
|---|---|---|---|
| Robins Mark W | $150,000 | -- |
Source: Public Records
Mortgage History
| Date | Status | Borrower | Loan Amount |
|---|---|---|---|
| Open | Robins Mark W | $135,000 |
Source: Public Records
Tax History Compared to Growth
Tax History
| Year | Tax Paid | Tax Assessment Tax Assessment Total Assessment is a certain percentage of the fair market value that is determined by local assessors to be the total taxable value of land and additions on the property. | Land | Improvement |
|---|---|---|---|---|
| 2025 | $9,909 | $888,700 | $324,200 | $564,500 |
| 2024 | $8,485 | $745,600 | $324,100 | $421,500 |
| 2023 | $8,023 | $656,000 | $252,100 | $403,900 |
| 2022 | $7,811 | $607,400 | $241,300 | $366,100 |
| 2021 | $7,751 | $586,300 | $239,500 | $346,800 |
| 2020 | $7,961 | $567,800 | $244,900 | $322,900 |
| 2019 | $7,482 | $531,000 | $237,700 | $293,300 |
| 2018 | $7,309 | $513,300 | $225,100 | $288,200 |
| 2017 | $7,329 | $516,500 | $216,100 | $300,400 |
| 2016 | $6,587 | $443,600 | $194,500 | $249,100 |
| 2015 | $5,699 | $421,800 | $187,300 | $234,500 |
Source: Public Records
Map
Nearby Homes
- 20 Summer St Unit 20
- 29 Summer St Unit 15
- 0 Lanes End
- 3 Jeffreys Neck Rd
- 11 Spillers Ln
- 16 Elm St
- 3 Soffron Ln Unit 2
- 50-56 Market St
- 11 Washington St
- 11 Washington St Unit 5
- 11 Washington St Unit 10
- 11 Washington St Unit 4
- 11 Washington St Unit 12
- 11 Washington St Unit Nine
- 23 Newmarch St
- 59 Washington St
- 12 1st St
- 50 Jeffreys Neck Rd
- 16 Appleton Park Unit F6
- 21 Brownville Ave
- 15 Spring St Unit A
- 15 Spring St Unit B
- 17 Spring St
- 7 Highland Ave
- 5 Highland Ave
- 9 Highland Ave Unit 1
- 13 Spring St
- 3 Highland Ave
- 10 Highland Ave
- 12 Highland Ave
- 12 Highland Ave Unit 2
- 12 Highland Ave Unit 1
- 19 Spring St
- 11 Spring St
- 1 Highland Ave
- 8 Highland Ave
- 6 Highland Ave
- 7 Spring St
- 34 East St
- 4 Highland Ave