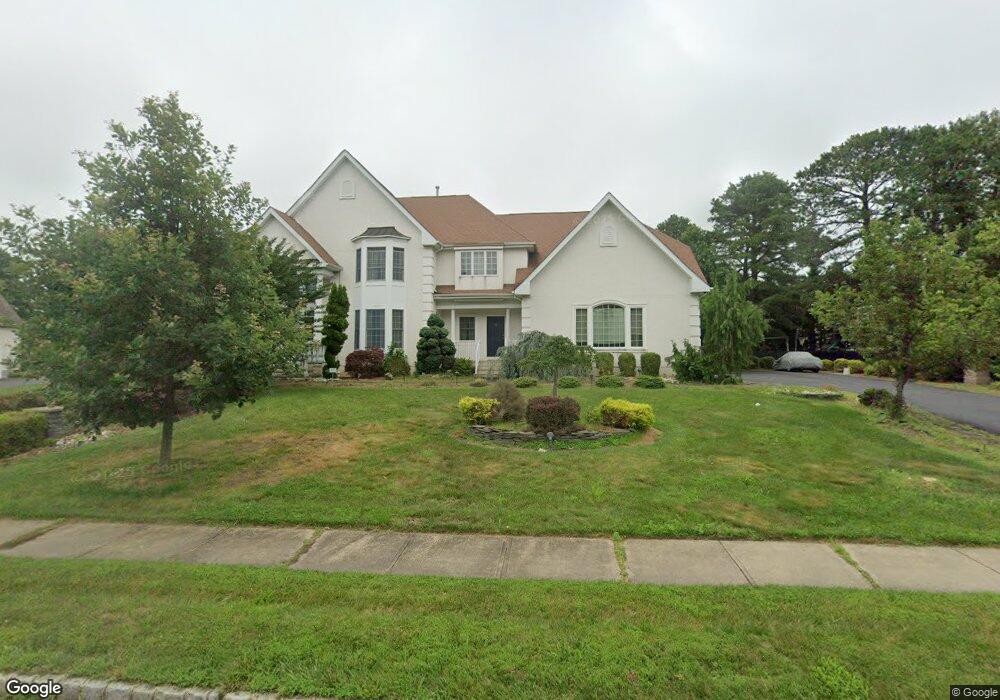
15 St James St Monroe Township, NJ 08831
Estimated Value: $1,420,000 - $1,560,780
5
Beds
5
Baths
5,000
Sq Ft
$303/Sq Ft
Est. Value
About This Home
This home is located at 15 St James St, Monroe Township, NJ 08831 and is currently estimated at $1,513,695, approximately $302 per square foot. 15 St James St is a home located in Middlesex County with nearby schools including Mill Lake Elementary School, Woodland Elementary School, and Monroe Township Middle School.
Ownership History
Date
Name
Owned For
Owner Type
Purchase Details
Closed on
Jun 24, 2019
Sold by
Song Sang Ho and Cho Alysa Y
Bought by
Song Sang Ho
Current Estimated Value
Purchase Details
Closed on
Aug 30, 2006
Sold by
Centex Homes
Bought by
Song Song Seng Seng and Song Alysai
Home Financials for this Owner
Home Financials are based on the most recent Mortgage that was taken out on this home.
Original Mortgage
$799,000
Outstanding Balance
$482,959
Interest Rate
6.79%
Estimated Equity
$1,030,736
Create a Home Valuation Report for This Property
The Home Valuation Report is an in-depth analysis detailing your home's value as well as a comparison with similar homes in the area
Home Values in the Area
Average Home Value in this Area
Purchase History
| Date | Buyer | Sale Price | Title Company |
|---|---|---|---|
| Song Sang Ho | -- | Coastal Title Agency | |
| Song Song Seng Seng | $999,000 | -- |
Source: Public Records
Mortgage History
| Date | Status | Borrower | Loan Amount |
|---|---|---|---|
| Open | Song Song Seng Seng | $799,000 |
Source: Public Records
Tax History Compared to Growth
Tax History
| Year | Tax Paid | Tax Assessment Tax Assessment Total Assessment is a certain percentage of the fair market value that is determined by local assessors to be the total taxable value of land and additions on the property. | Land | Improvement |
|---|---|---|---|---|
| 2025 | $23,456 | $840,400 | $204,300 | $636,100 |
| 2024 | $22,640 | $840,400 | $204,300 | $636,100 |
| 2023 | $22,640 | $840,400 | $204,300 | $636,100 |
| 2022 | $22,287 | $840,400 | $204,300 | $636,100 |
| 2021 | $16,615 | $840,400 | $204,300 | $636,100 |
| 2020 | $22,170 | $840,400 | $204,300 | $636,100 |
| 2019 | $21,691 | $840,400 | $204,300 | $636,100 |
| 2018 | $21,523 | $840,400 | $204,300 | $636,100 |
| 2017 | $21,102 | $840,400 | $204,300 | $636,100 |
| 2016 | $20,791 | $840,400 | $204,300 | $636,100 |
| 2015 | $20,203 | $840,400 | $204,300 | $636,100 |
| 2014 | $19,380 | $838,100 | $204,300 | $633,800 |
Source: Public Records
Map
Nearby Homes