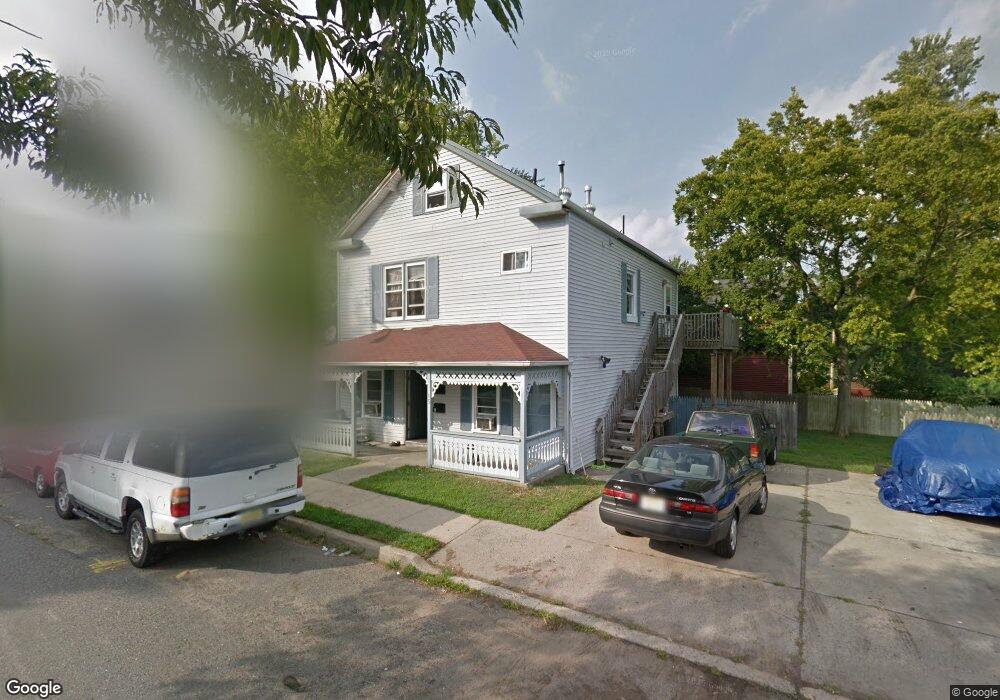
15 Stillwell St Matawan, NJ 07747
Estimated Value: $546,000 - $566,745
4
Beds
2
Baths
1,820
Sq Ft
$305/Sq Ft
Est. Value
About This Home
This home is located at 15 Stillwell St, Matawan, NJ 07747 and is currently estimated at $555,186, approximately $305 per square foot. 15 Stillwell St is a home located in Monmouth County with nearby schools including Matawan Reg High School, St. Joseph Elementary School, and St Benedict School.
Ownership History
Date
Name
Owned For
Owner Type
Purchase Details
Closed on
Apr 2, 2012
Sold by
Galant Vladimir
Bought by
Galant Seva
Current Estimated Value
Purchase Details
Closed on
Oct 24, 2006
Sold by
Weinstein Ira M
Bought by
Galant Seva and Galant Vladimir
Home Financials for this Owner
Home Financials are based on the most recent Mortgage that was taken out on this home.
Original Mortgage
$63,000
Outstanding Balance
$37,614
Interest Rate
6.47%
Mortgage Type
Commercial
Estimated Equity
$517,572
Purchase Details
Closed on
Apr 6, 2001
Sold by
Hynes Patrick
Bought by
Weinstein Ira and Weinstein Hilde
Home Financials for this Owner
Home Financials are based on the most recent Mortgage that was taken out on this home.
Original Mortgage
$161,910
Interest Rate
7.15%
Mortgage Type
Commercial
Purchase Details
Closed on
Feb 22, 1995
Sold by
Ford Consumer Fin Co
Bought by
Maganza Leon and Maganza Bobbie
Create a Home Valuation Report for This Property
The Home Valuation Report is an in-depth analysis detailing your home's value as well as a comparison with similar homes in the area
Home Values in the Area
Average Home Value in this Area
Purchase History
| Date | Buyer | Sale Price | Title Company |
|---|---|---|---|
| Galant Seva | -- | None Available | |
| Galant Seva | $315,000 | -- | |
| Weinstein Ira | $179,900 | -- | |
| Maganza Leon | $130,000 | -- |
Source: Public Records
Mortgage History
| Date | Status | Borrower | Loan Amount |
|---|---|---|---|
| Open | Galant Seva | $63,000 | |
| Previous Owner | Weinstein Ira | $161,910 |
Source: Public Records
Tax History Compared to Growth
Tax History
| Year | Tax Paid | Tax Assessment Tax Assessment Total Assessment is a certain percentage of the fair market value that is determined by local assessors to be the total taxable value of land and additions on the property. | Land | Improvement |
|---|---|---|---|---|
| 2025 | $9,972 | $498,700 | $278,500 | $220,200 |
| 2024 | $9,672 | $456,800 | $292,800 | $164,000 |
| 2023 | $9,672 | $444,900 | $283,300 | $161,600 |
| 2022 | $8,640 | $363,100 | $209,200 | $153,900 |
| 2021 | $6,419 | $318,000 | $177,800 | $140,200 |
| 2020 | $8,394 | $306,800 | $168,300 | $138,500 |
| 2019 | $8,179 | $299,600 | $164,500 | $135,100 |
| 2018 | $8,136 | $293,200 | $159,800 | $133,400 |
| 2017 | $7,913 | $281,100 | $150,300 | $130,800 |
| 2016 | $7,568 | $274,600 | $145,500 | $129,100 |
| 2015 | $6,982 | $255,300 | $131,300 | $124,000 |
| 2014 | $6,941 | $254,700 | $126,500 | $128,200 |
Source: Public Records
Map
Nearby Homes
- 32 Center St
- 11 Stillwell St
- 11 Stillwell St Unit B
- 28 Center St Unit 30
- 9 Stillwell St
- 34 Center St
- 25 Center St
- 29 Center St
- 35 Center St Unit 37
- 10 Stillwell St
- 9 Water St
- 2 Water St
- 31-33 Center St
- 31 Center St Unit 33
- 33 Center St
- 33 Center St Unit 2
- 6 Stillwell St
- 13 Orchard St
- 27 Center St Unit 29
- 6 Water St