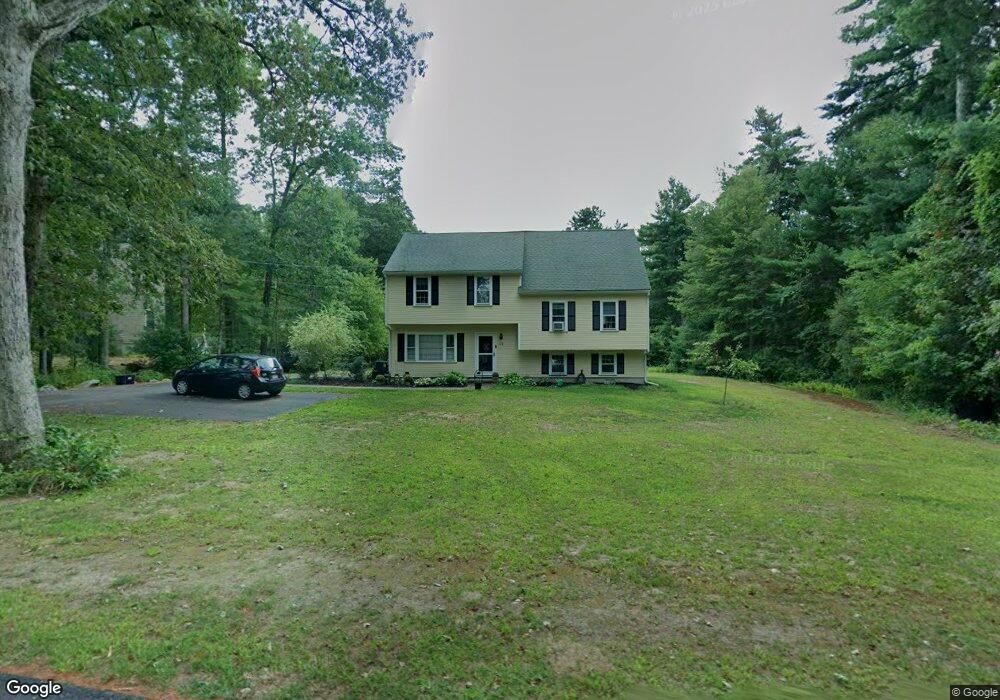
15 Stone St Middleboro, MA 02346
Estimated Value: $572,000 - $606,000
4
Beds
3
Baths
2,245
Sq Ft
$263/Sq Ft
Est. Value
About This Home
This home is located at 15 Stone St, Middleboro, MA 02346 and is currently estimated at $590,736, approximately $263 per square foot. 15 Stone St is a home located in Plymouth County with nearby schools including Mary K. Goode Elementary School and Samuel Fuller School.
Ownership History
Date
Name
Owned For
Owner Type
Purchase Details
Closed on
Oct 26, 2007
Sold by
Litton Loan Serving Lp
Bought by
Musser Wallace W and Holland Kelly A
Current Estimated Value
Home Financials for this Owner
Home Financials are based on the most recent Mortgage that was taken out on this home.
Original Mortgage
$250,400
Interest Rate
6.39%
Mortgage Type
Purchase Money Mortgage
Purchase Details
Closed on
Oct 16, 2007
Sold by
Melville Michelle A and Melville David A
Bought by
Deutsche Bank Natl T C
Home Financials for this Owner
Home Financials are based on the most recent Mortgage that was taken out on this home.
Original Mortgage
$250,400
Interest Rate
6.39%
Mortgage Type
Purchase Money Mortgage
Purchase Details
Closed on
Sep 29, 2004
Sold by
Whitney Mary A and Whitney Wayne T
Bought by
Melville David A and Melville Michelle A
Purchase Details
Closed on
Jun 15, 1993
Sold by
Holman Kerry G and Holman Karen J
Bought by
Stark Mary A
Create a Home Valuation Report for This Property
The Home Valuation Report is an in-depth analysis detailing your home's value as well as a comparison with similar homes in the area
Home Values in the Area
Average Home Value in this Area
Purchase History
| Date | Buyer | Sale Price | Title Company |
|---|---|---|---|
| Musser Wallace W | $313,000 | -- | |
| Deutsche Bank Natl T C | $352,080 | -- | |
| Melville David A | $406,000 | -- | |
| Stark Mary A | $130,000 | -- |
Source: Public Records
Mortgage History
| Date | Status | Borrower | Loan Amount |
|---|---|---|---|
| Open | Stark Mary A | $244,869 | |
| Closed | Stark Mary A | $250,400 |
Source: Public Records
Tax History Compared to Growth
Tax History
| Year | Tax Paid | Tax Assessment Tax Assessment Total Assessment is a certain percentage of the fair market value that is determined by local assessors to be the total taxable value of land and additions on the property. | Land | Improvement |
|---|---|---|---|---|
| 2025 | $6,229 | $464,500 | $165,600 | $298,900 |
| 2024 | $6,170 | $455,700 | $157,800 | $297,900 |
| 2023 | $5,724 | $402,000 | $157,800 | $244,200 |
| 2022 | $5,469 | $355,600 | $137,200 | $218,400 |
| 2021 | $5,511 | $338,700 | $120,300 | $218,400 |
| 2020 | $5,269 | $331,800 | $120,300 | $211,500 |
| 2019 | $4,923 | $318,000 | $120,300 | $197,700 |
| 2018 | $4,621 | $296,200 | $114,300 | $181,900 |
| 2017 | $4,412 | $279,800 | $110,100 | $169,700 |
| 2016 | $4,606 | $289,300 | $101,000 | $188,300 |
| 2015 | $4,108 | $260,300 | $101,000 | $159,300 |
Source: Public Records
Map
Nearby Homes