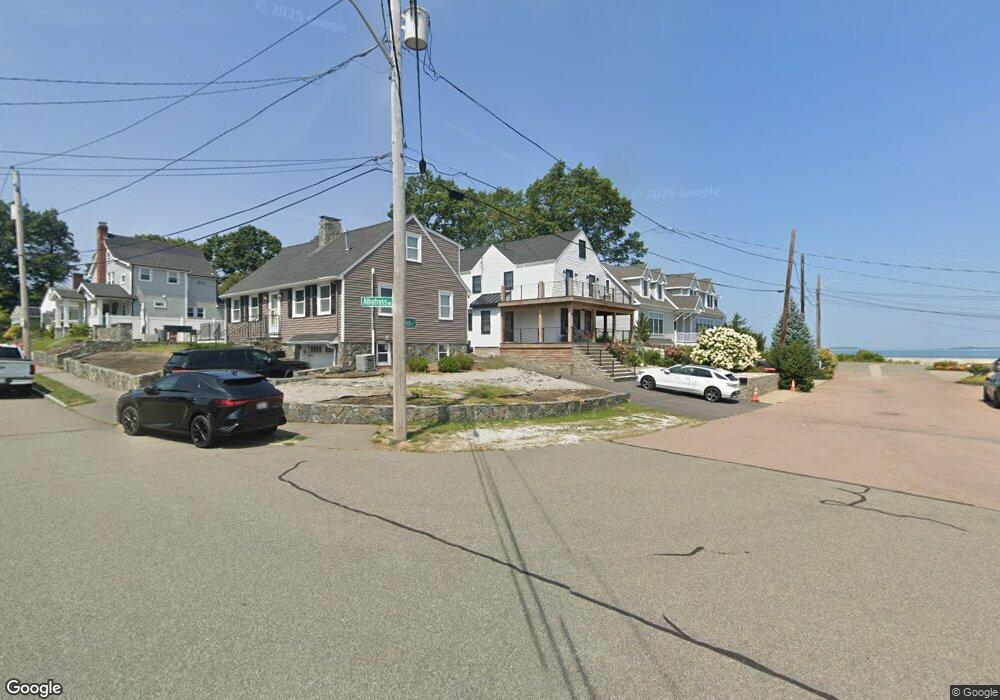
15 Swan Rd Quincy, MA 02169
Adams Shore NeighborhoodEstimated Value: $827,000 - $953,000
2
Beds
4
Baths
2,325
Sq Ft
$386/Sq Ft
Est. Value
About This Home
This home is located at 15 Swan Rd, Quincy, MA 02169 and is currently estimated at $897,025, approximately $385 per square foot. 15 Swan Rd is a home located in Norfolk County with nearby schools including Merrymount Elementary School, Broad Meadows Middle School, and Quincy High School.
Ownership History
Date
Name
Owned For
Owner Type
Purchase Details
Closed on
Oct 28, 2020
Sold by
Shea Ft
Bought by
Pharm Than C and Nguyen Jackie
Current Estimated Value
Home Financials for this Owner
Home Financials are based on the most recent Mortgage that was taken out on this home.
Original Mortgage
$464,000
Outstanding Balance
$413,635
Interest Rate
2.9%
Mortgage Type
New Conventional
Estimated Equity
$483,390
Purchase Details
Closed on
Aug 18, 2006
Sold by
Shea Geraldine M
Bought by
Shea Ft
Create a Home Valuation Report for This Property
The Home Valuation Report is an in-depth analysis detailing your home's value as well as a comparison with similar homes in the area
Home Values in the Area
Average Home Value in this Area
Purchase History
| Date | Buyer | Sale Price | Title Company |
|---|---|---|---|
| Pharm Than C | $580,000 | None Available | |
| Shea Ft | -- | -- |
Source: Public Records
Mortgage History
| Date | Status | Borrower | Loan Amount |
|---|---|---|---|
| Open | Pharm Than C | $464,000 |
Source: Public Records
Tax History Compared to Growth
Tax History
| Year | Tax Paid | Tax Assessment Tax Assessment Total Assessment is a certain percentage of the fair market value that is determined by local assessors to be the total taxable value of land and additions on the property. | Land | Improvement |
|---|---|---|---|---|
| 2025 | $11,130 | $965,300 | $302,000 | $663,300 |
| 2024 | $10,741 | $953,100 | $293,200 | $659,900 |
| 2023 | $9,591 | $861,700 | $254,900 | $606,800 |
| 2022 | $7,024 | $586,300 | $231,800 | $354,500 |
| 2021 | $6,153 | $506,800 | $231,800 | $275,000 |
| 2020 | $6,005 | $483,100 | $222,800 | $260,300 |
| 2019 | $5,829 | $464,500 | $208,300 | $256,200 |
| 2018 | $5,499 | $412,200 | $181,100 | $231,100 |
| 2017 | $5,604 | $395,500 | $181,100 | $214,400 |
| 2016 | $5,457 | $380,000 | $181,100 | $198,900 |
| 2015 | $5,300 | $363,000 | $170,900 | $192,100 |
| 2014 | $4,960 | $333,800 | $162,700 | $171,100 |
Source: Public Records
Map
Nearby Homes
- 73 Albatross Rd
- 503 Sea St
- 599 Sea St
- 599 Sea St Unit 1
- 37 Hobomack Rd
- 12 Quentin St
- 10 Forbush Ave
- 188 Samoset Ave
- 7 Manet Ave
- 1421 Quincy Shore Dr
- 105 Sea St Unit 301
- 105 Sea St Unit 203
- 105 Sea St Unit 105
- 1427 Quincy Shore Dr
- 200 Cove Way Unit 614
- 18 Allerton St
- 7-11 Lenox St
- 82 Lenox St
- 966 Sea St
- 202 Manet Ave
- 108 Albatross Rd
- 7 Swan Rd
- 69 Shellton Rd
- 100 Albatross Rd
- 75 Shellton Rd
- 75 Shellton Rd
- 65 Shellton Rd
- 65 Shellton Rd
- 71 Shellton Rd
- 18 Swan Rd
- 96 Albatross Rd
- 12 Swan Rd
- 81 Shellton Rd
- 109 Albatross Rd
- 113 Albatross Rd
- 61 Shellton Rd
- 83 Shellton Rd
- 59 Shellton Rd
- 85 Shellton Rd
- 85 Shellton Rd Unit 1