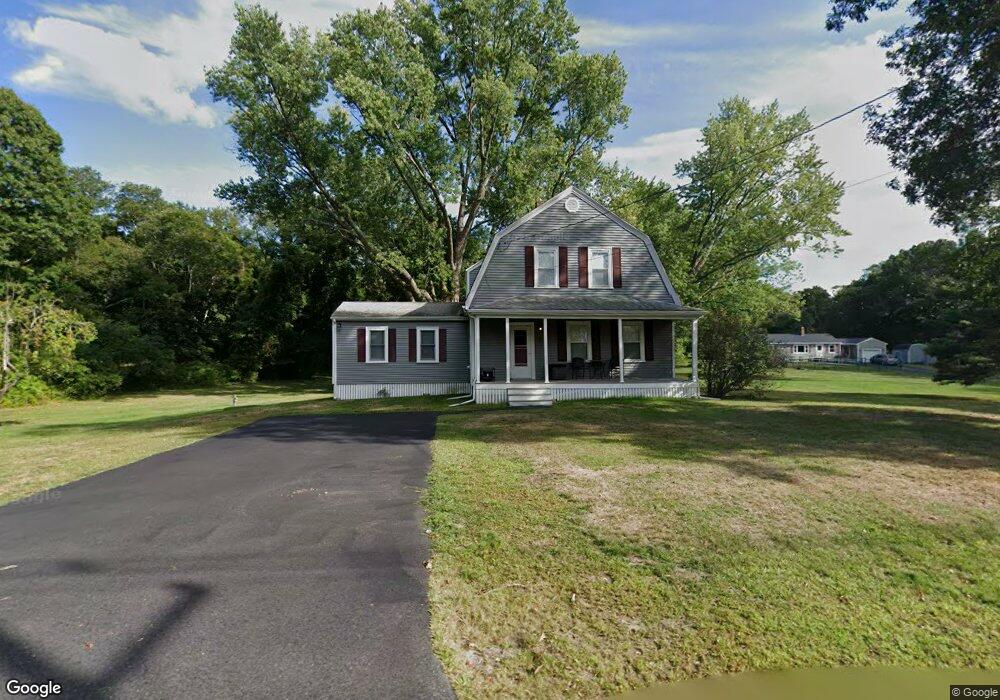
15 Taunton St Lakeville, MA 02347
Estimated Value: $570,407 - $638,000
3
Beds
3
Baths
1,980
Sq Ft
$311/Sq Ft
Est. Value
About This Home
This home is located at 15 Taunton St, Lakeville, MA 02347 and is currently estimated at $615,852, approximately $311 per square foot. 15 Taunton St is a home located in Plymouth County with nearby schools including Assawompset Elementary School, George R Austin Intermediate School, and Freetown-Lakeville Middle School.
Ownership History
Date
Name
Owned For
Owner Type
Purchase Details
Closed on
Jun 28, 2018
Sold by
Drew Ami A and Drew Richard R
Bought by
Drew Richard R
Current Estimated Value
Purchase Details
Closed on
Jan 10, 1994
Sold by
South Shore Bk
Bought by
Drew Richard R and Drew Ami A
Purchase Details
Closed on
May 26, 1988
Sold by
Maltais Richard E
Bought by
Maltais Glenn
Create a Home Valuation Report for This Property
The Home Valuation Report is an in-depth analysis detailing your home's value as well as a comparison with similar homes in the area
Home Values in the Area
Average Home Value in this Area
Purchase History
| Date | Buyer | Sale Price | Title Company |
|---|---|---|---|
| Drew Richard R | -- | -- | |
| Drew Richard R | $107,500 | -- | |
| Maltais Glenn | $115,000 | -- |
Source: Public Records
Mortgage History
| Date | Status | Borrower | Loan Amount |
|---|---|---|---|
| Previous Owner | Maltais Glenn | $248,000 | |
| Previous Owner | Maltais Glenn | $240,000 |
Source: Public Records
Tax History Compared to Growth
Tax History
| Year | Tax Paid | Tax Assessment Tax Assessment Total Assessment is a certain percentage of the fair market value that is determined by local assessors to be the total taxable value of land and additions on the property. | Land | Improvement |
|---|---|---|---|---|
| 2025 | $4,743 | $458,300 | $180,200 | $278,100 |
| 2024 | $4,618 | $437,700 | $176,700 | $261,000 |
| 2023 | $4,499 | $403,500 | $167,400 | $236,100 |
| 2022 | $4,363 | $361,500 | $150,600 | $210,900 |
| 2021 | $4,321 | $338,400 | $134,500 | $203,900 |
| 2020 | $4,258 | $326,000 | $130,300 | $195,700 |
| 2019 | $4,095 | $307,900 | $125,400 | $182,500 |
| 2018 | $3,957 | $291,200 | $117,000 | $174,200 |
| 2017 | $3,688 | $266,100 | $126,600 | $139,500 |
| 2016 | $3,418 | $241,900 | $110,600 | $131,300 |
| 2015 | $3,384 | $237,500 | $112,800 | $124,700 |
Source: Public Records
Map
Nearby Homes