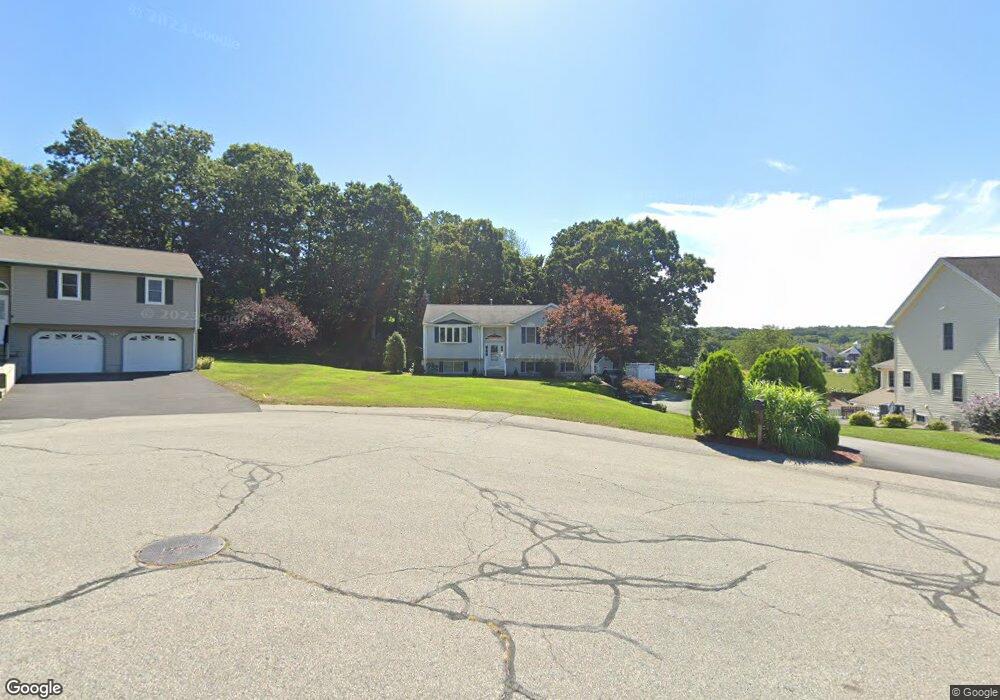
15 Thayer Ct North Smithfield, RI 02896
Estimated Value: $550,846 - $599,000
4
Beds
3
Baths
1,750
Sq Ft
$328/Sq Ft
Est. Value
About This Home
This home is located at 15 Thayer Ct, North Smithfield, RI 02896 and is currently estimated at $574,712, approximately $328 per square foot. 15 Thayer Ct is a home located in Providence County with nearby schools including North Smithfield Elementary School, North Smithfield Middle School, and North Smithfield High School.
Ownership History
Date
Name
Owned For
Owner Type
Purchase Details
Closed on
Apr 14, 1999
Sold by
Renaud Allen S and Renaud Bonnie J
Bought by
Bourque Marcel A and Bourque Jacqueline B
Current Estimated Value
Home Financials for this Owner
Home Financials are based on the most recent Mortgage that was taken out on this home.
Original Mortgage
$133,000
Outstanding Balance
$33,678
Interest Rate
7.04%
Mortgage Type
Purchase Money Mortgage
Estimated Equity
$541,034
Create a Home Valuation Report for This Property
The Home Valuation Report is an in-depth analysis detailing your home's value as well as a comparison with similar homes in the area
Home Values in the Area
Average Home Value in this Area
Purchase History
| Date | Buyer | Sale Price | Title Company |
|---|---|---|---|
| Bourque Marcel A | $170,000 | -- |
Source: Public Records
Mortgage History
| Date | Status | Borrower | Loan Amount |
|---|---|---|---|
| Open | Bourque Marcel A | $75,000 | |
| Open | Bourque Marcel A | $133,000 |
Source: Public Records
Tax History Compared to Growth
Tax History
| Year | Tax Paid | Tax Assessment Tax Assessment Total Assessment is a certain percentage of the fair market value that is determined by local assessors to be the total taxable value of land and additions on the property. | Land | Improvement |
|---|---|---|---|---|
| 2024 | $5,815 | $393,700 | $92,900 | $300,800 |
| 2023 | $5,610 | $393,700 | $92,900 | $300,800 |
| 2022 | $5,476 | $393,700 | $92,900 | $300,800 |
| 2021 | $5,576 | $342,300 | $75,300 | $267,000 |
| 2020 | $5,576 | $342,300 | $75,300 | $267,000 |
| 2019 | $5,432 | $342,300 | $75,300 | $267,000 |
| 2018 | $5,262 | $305,200 | $86,500 | $218,700 |
| 2017 | $5,133 | $305,200 | $86,500 | $218,700 |
| 2016 | $4,993 | $305,200 | $86,500 | $218,700 |
| 2015 | $4,749 | $284,700 | $76,900 | $207,800 |
| 2014 | $4,561 | $284,700 | $76,900 | $207,800 |
Source: Public Records
Map
Nearby Homes
- 28 White Pkwy
- 604 Providence St
- 0 Chester St
- 27 Irene Blvd
- 34 Smithfield Rd
- 184 Avenue C Unit 6
- 184 Avenue C Unit 1
- 184 Avenue C
- 184 Avenue C Unit 2
- 184 Avenue C Unit 4
- 25 Ormond St
- 595 S Main St
- 257 Orchard St
- 23 Middle St
- 132 Greenville Rd
- 88 Homestead Ave
- 124 Darwin St
- 61 Warwick St
- 0 Laflamme Ave
- 109 Hemond Ave