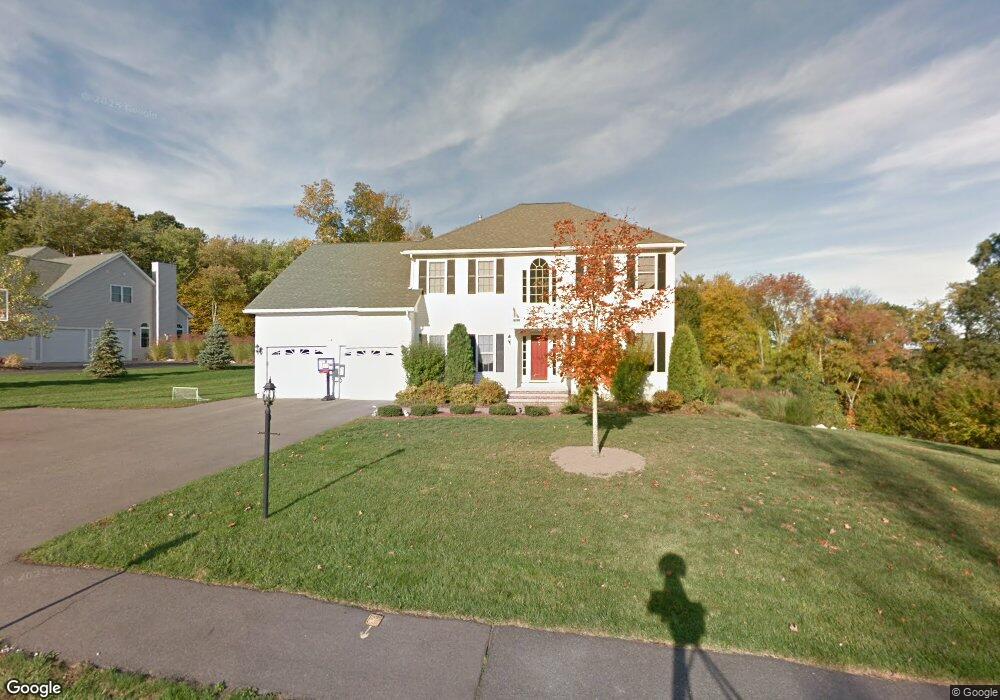
15 Thurston Ln Ashland, MA 01721
Estimated Value: $1,057,141 - $1,263,000
4
Beds
3
Baths
2,488
Sq Ft
$476/Sq Ft
Est. Value
About This Home
This home is located at 15 Thurston Ln, Ashland, MA 01721 and is currently estimated at $1,184,285, approximately $475 per square foot. 15 Thurston Ln is a home located in Middlesex County with nearby schools including William Pittaway Elementary School, David Mindess Elementary School, and Henry E. Warren Elementary School.
Ownership History
Date
Name
Owned For
Owner Type
Purchase Details
Closed on
Jun 3, 2011
Sold by
Cecilia Ann Milko Lt
Bought by
Silverman Alyssa E and Silverman James M
Current Estimated Value
Home Financials for this Owner
Home Financials are based on the most recent Mortgage that was taken out on this home.
Original Mortgage
$390,000
Outstanding Balance
$260,771
Interest Rate
4%
Mortgage Type
Purchase Money Mortgage
Estimated Equity
$923,514
Purchase Details
Closed on
Mar 12, 2009
Sold by
Milko Edward and Milko Cecilia
Bought by
Milko Tr Cecilia Ann and Milko Edward Michael
Purchase Details
Closed on
Mar 11, 2008
Sold by
Evergreen Ests Rt
Bought by
Milko Cecilia and Milko Edward
Home Financials for this Owner
Home Financials are based on the most recent Mortgage that was taken out on this home.
Original Mortgage
$120,000
Interest Rate
5.57%
Mortgage Type
Purchase Money Mortgage
Create a Home Valuation Report for This Property
The Home Valuation Report is an in-depth analysis detailing your home's value as well as a comparison with similar homes in the area
Home Values in the Area
Average Home Value in this Area
Purchase History
| Date | Buyer | Sale Price | Title Company |
|---|---|---|---|
| Silverman Alyssa E | $600,000 | -- | |
| Milko Tr Cecilia Ann | -- | -- | |
| Milko Cecilia | $620,000 | -- |
Source: Public Records
Mortgage History
| Date | Status | Borrower | Loan Amount |
|---|---|---|---|
| Open | Silverman Alyssa E | $390,000 | |
| Previous Owner | Milko Cecilia | $120,000 |
Source: Public Records
Tax History Compared to Growth
Tax History
| Year | Tax Paid | Tax Assessment Tax Assessment Total Assessment is a certain percentage of the fair market value that is determined by local assessors to be the total taxable value of land and additions on the property. | Land | Improvement |
|---|---|---|---|---|
| 2025 | $13,476 | $1,055,300 | $316,200 | $739,100 |
| 2024 | $12,958 | $978,700 | $316,200 | $662,500 |
| 2023 | $11,906 | $864,600 | $301,200 | $563,400 |
| 2022 | $12,008 | $756,200 | $273,600 | $482,600 |
| 2021 | $11,478 | $720,500 | $273,600 | $446,900 |
| 2020 | $13,064 | $703,300 | $273,600 | $429,700 |
| 2019 | $13,175 | $688,200 | $273,600 | $414,600 |
| 2018 | $11,099 | $668,200 | $269,300 | $398,900 |
| 2017 | $10,157 | $608,200 | $268,100 | $340,100 |
| 2016 | $10,030 | $590,000 | $261,200 | $328,800 |
| 2015 | $9,915 | $573,100 | $248,300 | $324,800 |
| 2014 | $9,803 | $563,700 | $238,100 | $325,600 |
Source: Public Records
Map
Nearby Homes
- 9 Olive St
- 60 Frankland Rd
- 28-30 Olive St
- 11 Voyagers Ln
- 101 Olive St
- 20 Braeburn Ln
- 0 Cross St
- 13 Clark St
- 203 Pleasant St
- 0 Ballard Highland Marietta Unit 73391306
- 10 Clinton St
- 638 Main St
- 25 Prospect St
- 49 Prospect St
- 6 New Castle Rd
- 3 Blueberry Hill Ln
- The Majesty Plan at Constitution Village
- The Alexander Plan at Constitution Village
- The Countess Plan at Constitution Village
- Jasmine Glory Plan at Constitution Village
- 19 Thurston Ln
- 11 Thurston Ln
- 10 Thurston Ln
- 9 Thurston Ln
- 12 Thurston Ln
- 12 Thurston Ln Unit Lot 9
- 16 Thurston Ln
- 23 Thurston Ln
- 8 Thurston Ln
- 5 Thurston Ln
- 20 Thurston Ln
- 20 Thurston Ln Unit 20
- 4 Thurston Ln
- 3 Thurston Ln
- 11 Frankland Rd
- 23 Frankland Rd
- 1 Thurston Ln
- 31 Frankland Rd
- 19 Frankland Rd
- 35 Frankland Rd