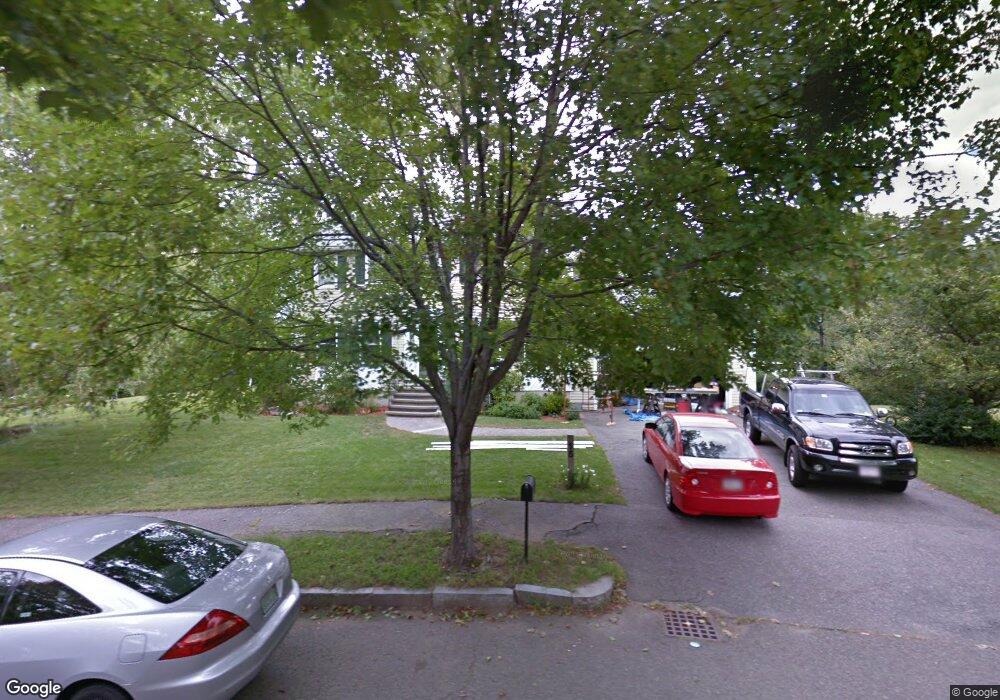
15 Tobey Ln Wakefield, MA 01880
Montrose NeighborhoodEstimated Value: $931,000 - $1,021,000
4
Beds
3
Baths
2,016
Sq Ft
$492/Sq Ft
Est. Value
About This Home
This home is located at 15 Tobey Ln, Wakefield, MA 01880 and is currently estimated at $992,805, approximately $492 per square foot. 15 Tobey Ln is a home located in Middlesex County with nearby schools including Wakefield Memorial High School, St Joseph School, and Odyssey Day School.
Ownership History
Date
Name
Owned For
Owner Type
Purchase Details
Closed on
May 22, 2023
Sold by
Deguglielmo Joseph and Deguglielmo Janet E
Bought by
J & Joe Deguglielmo Ft
Current Estimated Value
Purchase Details
Closed on
Feb 15, 1991
Sold by
Hanright Kenneth M and Hanright Ronald F
Bought by
Deguglielmo Joseph and Deguglielmo Janet E
Create a Home Valuation Report for This Property
The Home Valuation Report is an in-depth analysis detailing your home's value as well as a comparison with similar homes in the area
Home Values in the Area
Average Home Value in this Area
Purchase History
| Date | Buyer | Sale Price | Title Company |
|---|---|---|---|
| J & Joe Deguglielmo Ft | -- | None Available | |
| Deguglielmo Joseph | $238,000 | -- |
Source: Public Records
Mortgage History
| Date | Status | Borrower | Loan Amount |
|---|---|---|---|
| Previous Owner | Deguglielmo Joseph | $30,000 | |
| Previous Owner | Deguglielmo Joseph | $135,000 | |
| Previous Owner | Deguglielmo Joseph | $135,000 | |
| Previous Owner | Deguglielmo Joseph | $134,000 |
Source: Public Records
Tax History
| Year | Tax Paid | Tax Assessment Tax Assessment Total Assessment is a certain percentage of the fair market value that is determined by local assessors to be the total taxable value of land and additions on the property. | Land | Improvement |
|---|---|---|---|---|
| 2025 | $10,794 | $951,000 | $398,300 | $552,700 |
| 2024 | $10,699 | $951,000 | $398,300 | $552,700 |
| 2023 | $10,427 | $888,900 | $372,300 | $516,600 |
| 2022 | $9,956 | $808,100 | $338,400 | $469,700 |
| 2021 | $8,982 | $705,600 | $278,800 | $426,800 |
| 2020 | $9,011 | $705,600 | $278,800 | $426,800 |
| 2019 | $8,739 | $681,100 | $269,100 | $412,000 |
| 2018 | $8,423 | $650,400 | $257,000 | $393,400 |
| 2017 | $7,994 | $613,500 | $242,400 | $371,100 |
| 2016 | $7,364 | $545,900 | $225,000 | $320,900 |
| 2015 | $7,144 | $530,000 | $218,400 | $311,600 |
| 2014 | $6,773 | $530,000 | $218,400 | $311,600 |
Source: Public Records
Map
Nearby Homes
- 57 Wave Ave
- 29 Cordis St
- 67 Woodcrest Dr
- 68 Preston St Unit 6D
- 16 Beebe Ln
- 16 Pleasant St
- 270 Lowell St
- 43-45 Crescent St
- 9 Cyrus St
- 10 Wakefield Ave Unit B
- 350 Water St
- 35 Richardson St Unit 2
- 21 Herbert St Unit A
- 1 Traverse St Unit E
- 50 Tuttle St Unit 12
- 5 Jessica Ln
- 159 Main St
- 62 Foundry St Unit 310
- 62 Foundry St Unit 204
- 62 Foundry St Unit 402
Your Personal Tour Guide
Ask me questions while you tour the home.