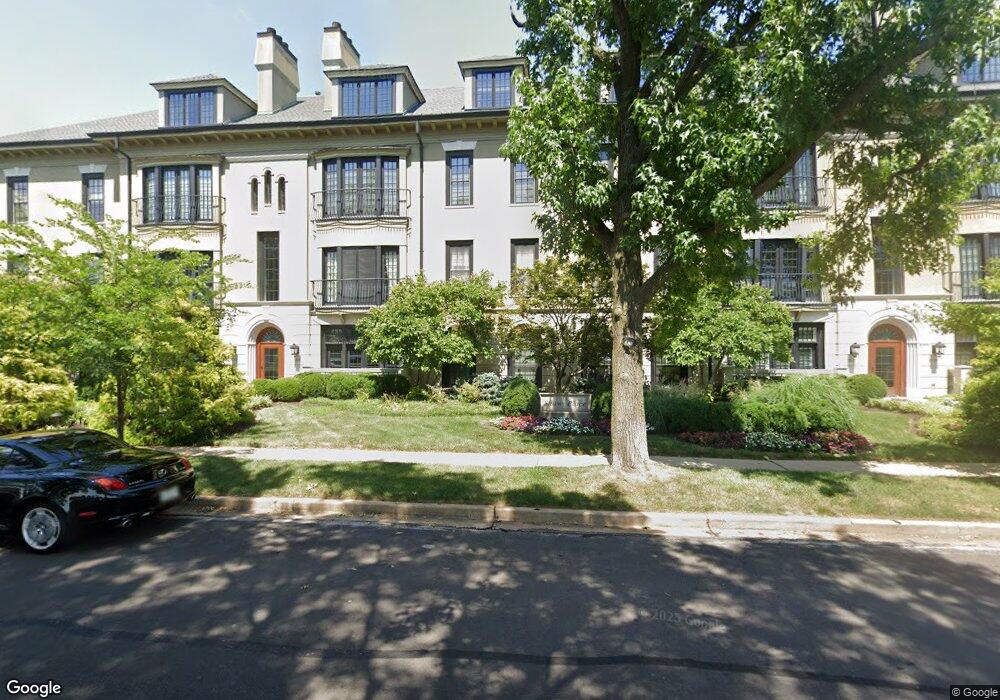
15 Topton Way Unit 3D Saint Louis, MO 63105
Downtown Clayton NeighborhoodEstimated Value: $1,076,000 - $1,425,000
3
Beds
3
Baths
2,668
Sq Ft
$489/Sq Ft
Est. Value
About This Home
This home is located at 15 Topton Way Unit 3D, Saint Louis, MO 63105 and is currently estimated at $1,305,162, approximately $489 per square foot. 15 Topton Way Unit 3D is a home located in St. Louis County with nearby schools including Meramec Elementary, Wydown Middle School, and Clayton High School.
Ownership History
Date
Name
Owned For
Owner Type
Purchase Details
Closed on
Mar 28, 2012
Sold by
Murray Richard T and Billingsley Cynthia J
Bought by
Murray Richard T and Billingsley Cynthia J
Current Estimated Value
Purchase Details
Closed on
Sep 20, 2010
Sold by
Pope James William
Bought by
Murray Richard T and Billingsley Cynthia J
Home Financials for this Owner
Home Financials are based on the most recent Mortgage that was taken out on this home.
Original Mortgage
$375,000
Outstanding Balance
$248,503
Interest Rate
4.51%
Mortgage Type
New Conventional
Estimated Equity
$1,056,659
Purchase Details
Closed on
Nov 7, 2001
Sold by
Pope Harold D and Pope Barbara J
Bought by
Pope Harold Dean and The Harold Dean Pope Revocable Trust
Purchase Details
Closed on
Aug 6, 2001
Sold by
Shaw Place Llc
Bought by
Pope Harold D and Pope Barbara J
Create a Home Valuation Report for This Property
The Home Valuation Report is an in-depth analysis detailing your home's value as well as a comparison with similar homes in the area
Home Values in the Area
Average Home Value in this Area
Purchase History
| Date | Buyer | Sale Price | Title Company |
|---|---|---|---|
| Murray Richard T | -- | None Available | |
| Murray Richard T | $750,000 | Fatco | |
| Pope Harold Dean | -- | -- | |
| Pope Harold D | $675,000 | -- |
Source: Public Records
Mortgage History
| Date | Status | Borrower | Loan Amount |
|---|---|---|---|
| Open | Murray Richard T | $375,000 |
Source: Public Records
Tax History Compared to Growth
Tax History
| Year | Tax Paid | Tax Assessment Tax Assessment Total Assessment is a certain percentage of the fair market value that is determined by local assessors to be the total taxable value of land and additions on the property. | Land | Improvement |
|---|---|---|---|---|
| 2025 | $12,458 | $203,930 | $77,050 | $126,880 |
| 2024 | $12,458 | $183,160 | $53,220 | $129,940 |
| 2023 | $12,444 | $183,160 | $53,220 | $129,940 |
| 2022 | $12,535 | $174,540 | $63,880 | $110,660 |
| 2021 | $12,491 | $174,540 | $63,880 | $110,660 |
| 2020 | $12,123 | $164,090 | $63,880 | $100,210 |
| 2019 | $11,961 | $164,090 | $63,880 | $100,210 |
| 2018 | $10,605 | $148,000 | $39,030 | $108,970 |
| 2017 | $10,535 | $148,000 | $39,030 | $108,970 |
| 2016 | $9,792 | $131,010 | $39,030 | $91,980 |
| 2015 | $9,878 | $131,010 | $39,030 | $91,980 |
| 2014 | $9,949 | $126,730 | $53,140 | $73,590 |
Source: Public Records
Map
Nearby Homes
- 10 Brighton Way Unit 1
- 8250 Forsyth Blvd Unit 109
- 8250 Forsyth Blvd Unit 303
- 8250 Forsyth Blvd Unit 402
- 8250 Forsyth Blvd Unit 408
- 8250 Forsyth Blvd Unit 405
- 8250 Forsyth Blvd Unit 210
- 8250 Forsyth Blvd Unit 103
- 8250 Forsyth Blvd Unit 404
- 8250 Forsyth Blvd Unit 105
- 8250 Forsyth Blvd Unit 208
- 8250 Forsyth Blvd Unit 401
- 8250 Forsyth Blvd Unit 310
- 8250 Forsyth Blvd Unit 107
- 8250 Forsyth Blvd Unit 406
- 8250 Forsyth Blvd Unit 403
- 8250 Forsyth Blvd Unit 104
- 8250 Forsyth Blvd Unit 407
- 8250 Forsyth Blvd Unit 302
- 8250 Forsyth Blvd Unit 309
- 15 Topton Way Unit 3A
- 15 Topton Way Unit 1D
- 15 Topton Way Unit NPH
- 15 Topton Way Unit 2A
- 15 Topton Way Unit 3C
- 15 Topton Way Unit 1A
- 15 Topton Way Unit 2C
- 15 Topton Way Unit 1C
- 15 Topton Way Unit 3B
- 15 Topton Way Unit 1B
- 15 Topton Way Unit 2B
- 15 Topton Way Unit SPH
- 15 Topton Way Unit 2D
- 15 Topton Way Unit 4N
- 6 Brighton Way Unit 1A
- 6 Brighton Way Unit 2A
- 6 Brighton Way Unit 3C
- 6 Brighton Way Unit 1B
- 10 Brighton Way Unit 2S
- 10 Brighton Way Unit 2N