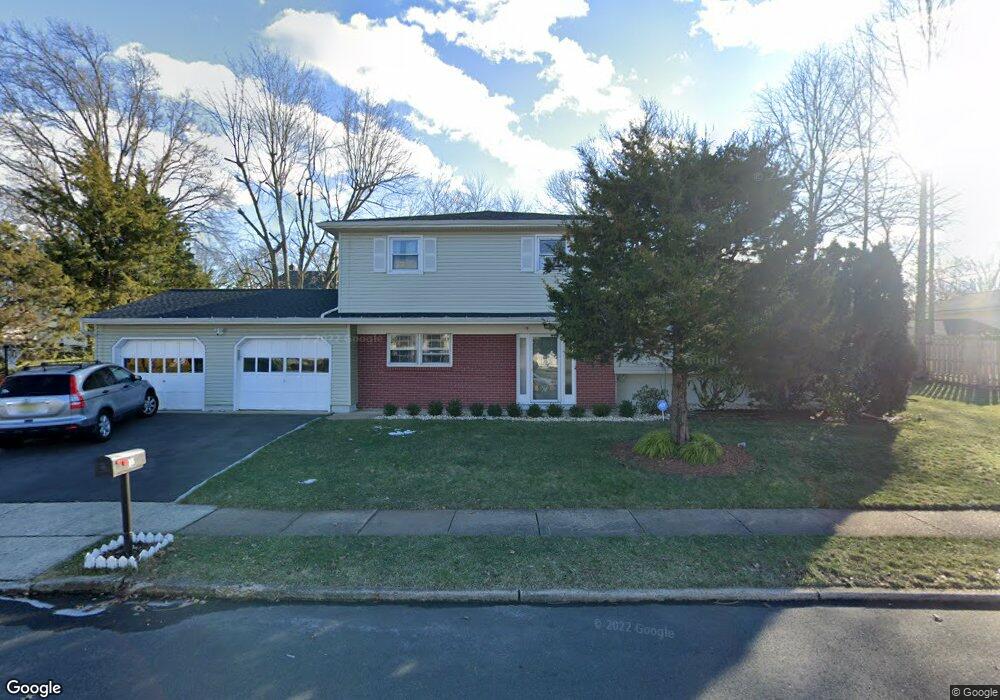
15 Tyroler Ct Edison, NJ 08820
Estimated Value: $827,592 - $949,000
4
Beds
3
Baths
1,976
Sq Ft
$443/Sq Ft
Est. Value
About This Home
This home is located at 15 Tyroler Ct, Edison, NJ 08820 and is currently estimated at $875,898, approximately $443 per square foot. 15 Tyroler Ct is a home located in Middlesex County with nearby schools including Menlo Park Elementary School, Woodrow Wilson Middle School, and J.P. Stevens High School.
Ownership History
Date
Name
Owned For
Owner Type
Purchase Details
Closed on
May 6, 2019
Sold by
Burlak Eduard
Bought by
Sharma Sachin and Mullick Garima
Current Estimated Value
Home Financials for this Owner
Home Financials are based on the most recent Mortgage that was taken out on this home.
Original Mortgage
$372,000
Outstanding Balance
$327,063
Interest Rate
4.2%
Mortgage Type
New Conventional
Estimated Equity
$548,835
Purchase Details
Closed on
Oct 6, 2015
Sold by
Burlak Oleg
Bought by
Burlak Oleg and Burlak Eduard
Create a Home Valuation Report for This Property
The Home Valuation Report is an in-depth analysis detailing your home's value as well as a comparison with similar homes in the area
Home Values in the Area
Average Home Value in this Area
Purchase History
| Date | Buyer | Sale Price | Title Company |
|---|---|---|---|
| Sharma Sachin | $474,300 | North East Title Agency Llc | |
| Burlak Oleg | -- | None Available |
Source: Public Records
Mortgage History
| Date | Status | Borrower | Loan Amount |
|---|---|---|---|
| Open | Sharma Sachin | $372,000 |
Source: Public Records
Tax History Compared to Growth
Tax History
| Year | Tax Paid | Tax Assessment Tax Assessment Total Assessment is a certain percentage of the fair market value that is determined by local assessors to be the total taxable value of land and additions on the property. | Land | Improvement |
|---|---|---|---|---|
| 2025 | $12,067 | $202,700 | $106,200 | $96,500 |
| 2024 | $12,002 | $202,700 | $106,200 | $96,500 |
| 2023 | $12,002 | $202,700 | $106,200 | $96,500 |
| 2022 | $12,006 | $202,700 | $106,200 | $96,500 |
| 2021 | $11,965 | $202,700 | $106,200 | $96,500 |
| 2020 | $11,856 | $202,700 | $106,200 | $96,500 |
| 2019 | $11,393 | $206,400 | $106,200 | $100,200 |
| 2018 | $11,194 | $206,400 | $106,200 | $100,200 |
| 2017 | $11,091 | $206,400 | $106,200 | $100,200 |
| 2016 | $10,890 | $206,400 | $106,200 | $100,200 |
| 2015 | $10,473 | $206,400 | $106,200 | $100,200 |
| 2014 | $10,167 | $206,400 | $106,200 | $100,200 |
Source: Public Records
Map
Nearby Homes