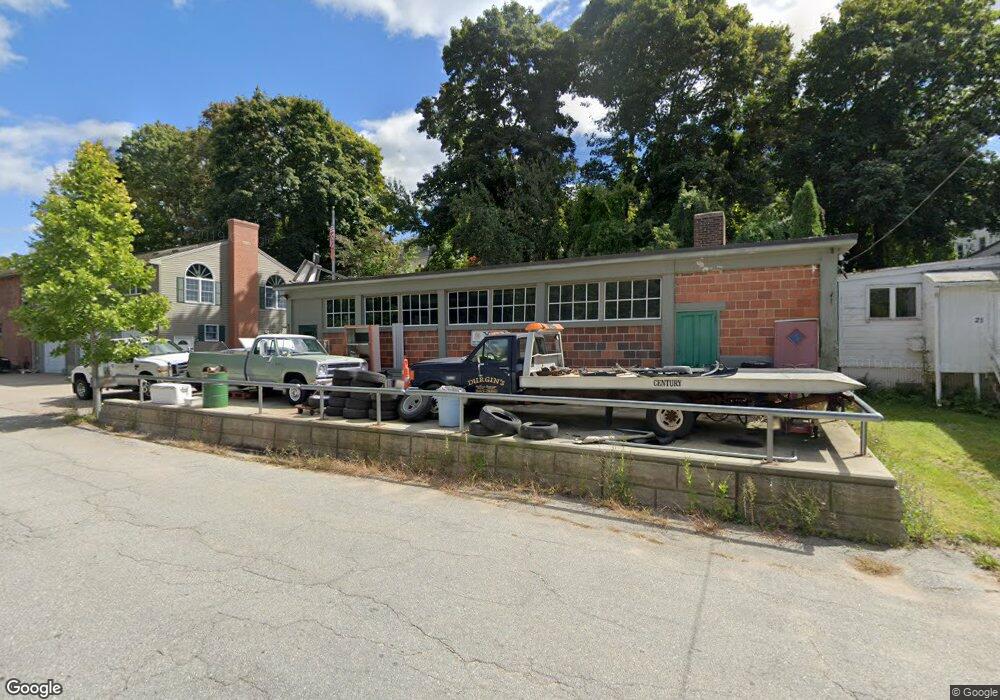
15 Valley St Spencer, MA 01562
Estimated Value: $66,000
4
Beds
2
Baths
2,634
Sq Ft
$25/Sq Ft
Est. Value
About This Home
This home is located at 15 Valley St, Spencer, MA 01562 and is currently priced at $66,000, approximately $25 per square foot. 15 Valley St is a home located in Worcester County with nearby schools including David Prouty High School.
Ownership History
Date
Name
Owned For
Owner Type
Purchase Details
Closed on
Apr 20, 2022
Sold by
Durgin Joelyn E
Bought by
Sasser Anne P and Sasser Norvin Morris
Current Estimated Value
Home Financials for this Owner
Home Financials are based on the most recent Mortgage that was taken out on this home.
Original Mortgage
$440,000
Outstanding Balance
$410,031
Interest Rate
3.85%
Mortgage Type
Purchase Money Mortgage
Purchase Details
Closed on
Jul 25, 2018
Sold by
Durgin David P Est and Durgin
Bought by
Durgin Joelyn E
Create a Home Valuation Report for This Property
The Home Valuation Report is an in-depth analysis detailing your home's value as well as a comparison with similar homes in the area
Home Values in the Area
Average Home Value in this Area
Purchase History
| Date | Buyer | Sale Price | Title Company |
|---|---|---|---|
| Sasser Anne P | $550,000 | None Available | |
| Durgin Joelyn E | -- | -- |
Source: Public Records
Mortgage History
| Date | Status | Borrower | Loan Amount |
|---|---|---|---|
| Open | Sasser Anne P | $440,000 |
Source: Public Records
Tax History Compared to Growth
Tax History
| Year | Tax Paid | Tax Assessment Tax Assessment Total Assessment is a certain percentage of the fair market value that is determined by local assessors to be the total taxable value of land and additions on the property. | Land | Improvement |
|---|---|---|---|---|
| 2025 | $64 | $545,500 | $37,400 | $508,100 |
| 2024 | $5,943 | $519,500 | $37,400 | $482,100 |
| 2023 | $5,416 | $449,100 | $37,400 | $411,700 |
| 2022 | $4,859 | $369,200 | $34,000 | $335,200 |
| 2021 | $4,810 | $342,600 | $34,000 | $308,600 |
| 2020 | $4,435 | $314,100 | $34,000 | $280,100 |
| 2019 | $4,200 | $303,000 | $29,900 | $273,100 |
| 2018 | $3,707 | $276,200 | $35,700 | $240,500 |
| 2017 | $3,660 | $261,800 | $34,000 | $227,800 |
| 2016 | $3,194 | $223,500 | $34,000 | $189,500 |
| 2015 | $3,068 | $224,400 | $39,200 | $185,200 |
| 2014 | $2,951 | $224,400 | $39,200 | $185,200 |
Source: Public Records
Map
Nearby Homes