15 W 4800 S Murray, UT 84107
--
Bed
--
Bath
4,755
Sq Ft
0.32
Acres
About This Home
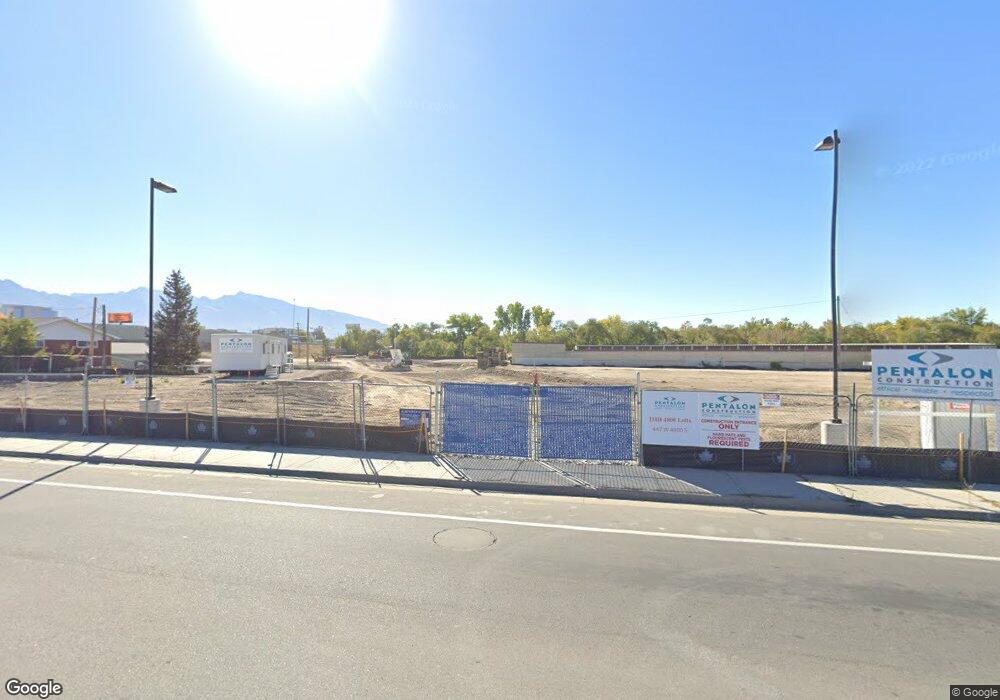
This home is located at 15 W 4800 S, Murray, UT 84107. 15 W 4800 S is a home located in Salt Lake County with nearby schools including Parkside Elementary School, Hillcrest Junior High School, and Murray High School.
Ownership History
Date
Name
Owned For
Owner Type
Purchase Details
Closed on
Nov 22, 2000
Sold by
Stirling Construction Inc
Bought by
Stirling Curtis J and Stirling Kay L
Purchase Details
Closed on
Jun 24, 1998
Sold by
Japanese Engines Inc
Bought by
Bitner Brian K and Bitner Carolyn O
Home Financials for this Owner
Home Financials are based on the most recent Mortgage that was taken out on this home.
Original Mortgage
$220,500
Interest Rate
7.17%
Mortgage Type
Construction
Purchase Details
Closed on
Feb 25, 1997
Sold by
Yu Ellen W F and Yu Jack S L
Bought by
Japanese Engines Inc
Home Financials for this Owner
Home Financials are based on the most recent Mortgage that was taken out on this home.
Original Mortgage
$31,378
Interest Rate
7.86%
Mortgage Type
Seller Take Back
Purchase Details
Closed on
Sep 17, 1996
Sold by
Billings Edward M
Bought by
Yu Ellen W F and Yu Jack S L
Purchase Details
Closed on
Nov 7, 1995
Sold by
Diana Frank
Bought by
Billings Edward M and Billings Karen D
Create a Home Valuation Report for This Property
The Home Valuation Report is an in-depth analysis detailing your home's value as well as a comparison with similar homes in the area
Home Values in the Area
Average Home Value in this Area
Purchase History
| Date | Buyer | Sale Price | Title Company |
|---|---|---|---|
| Stirling Curtis J | -- | -- | |
| Bitner Brian K | -- | -- | |
| Japanese Engines Inc | -- | -- | |
| Yu Ellen W F | -- | -- | |
| Billings Edward M | -- | -- |
Source: Public Records
Mortgage History
| Date | Status | Borrower | Loan Amount |
|---|---|---|---|
| Previous Owner | Bitner Brian K | $220,500 | |
| Previous Owner | Japanese Engines Inc | $31,378 |
Source: Public Records
Tax History Compared to Growth
Tax History
| Year | Tax Paid | Tax Assessment Tax Assessment Total Assessment is a certain percentage of the fair market value that is determined by local assessors to be the total taxable value of land and additions on the property. | Land | Improvement |
|---|---|---|---|---|
| 2025 | $8,782 | $1,132,200 | $386,800 | $745,400 |
| 2024 | $8,782 | $1,071,200 | $376,400 | $694,800 |
| 2023 | $7,745 | $904,900 | $204,900 | $700,000 |
| 2022 | $7,388 | $820,600 | $153,300 | $667,300 |
| 2021 | $7,062 | $691,800 | $147,700 | $544,100 |
| 2020 | $5,414 | $501,900 | $143,700 | $358,200 |
| 2019 | $5,600 | $501,500 | $139,700 | $361,800 |
| 2018 | $5,540 | $506,300 | $139,700 | $366,600 |
| 2017 | $4,775 | $440,000 | $127,700 | $312,300 |
| 2016 | $3,842 | $341,800 | $123,700 | $218,100 |
| 2015 | $3,457 | $279,300 | $123,700 | $155,600 |
| 2014 | $3,069 | $245,900 | $123,700 | $122,200 |
Source: Public Records
Map
Nearby Homes
- 4726 S Hillhouse Cove Unit 104
- 4730 S Box Elder St
- 6 W Miller St
- 149 E Vine St
- 155 E Vine St
- 4658 Box Elder St
- 4727 S Duftown Place
- 4784 S Huntly Dr
- 4753 S Falkirk Dr
- 4641 S Rainbow Dr
- 4584 S Commerce Dr
- 313 Elm St
- 4950 Galleria Dr
- 4757 S Meadowview Rd
- 436 Moss Creek Dr
- 424 Shamrock Dr
- 4344 S Main St
- 4364 S Detroiter Cir
- 496 E Spruce Glen Rd
- 599 E Savvy Cove S Unit 44
- 24 W 5th Ave
- 6 E 4800 S
- 32 W 5th Ave
- 4871 Box Elder St Unit 401
- 4871 Box Elder St Unit 402
- 4871 Box Elder St Unit 302
- 4871 Box Elder St Unit 202
- 4871 Box Elder St Unit 201
- 4871 Box Elder St Unit 102
- 4871 Box Elder St Unit 101
- 4871 Box Elder St Unit 301
- 20 E 4800 S
- 5 E 4800 S
- 33 E 5th Ave
- 15 W 5th Ave
- 4796 Box Elder St
- 4874 S Box Elder St
- 17 E 4800 S
- 4794 S Box Elder St
- 4794 Box Elder St