15 Walnut St Lynnfield, MA 01940
Estimated Value: $2,440,780 - $3,174,000
5
Beds
6
Baths
7,844
Sq Ft
$366/Sq Ft
Est. Value
About This Home
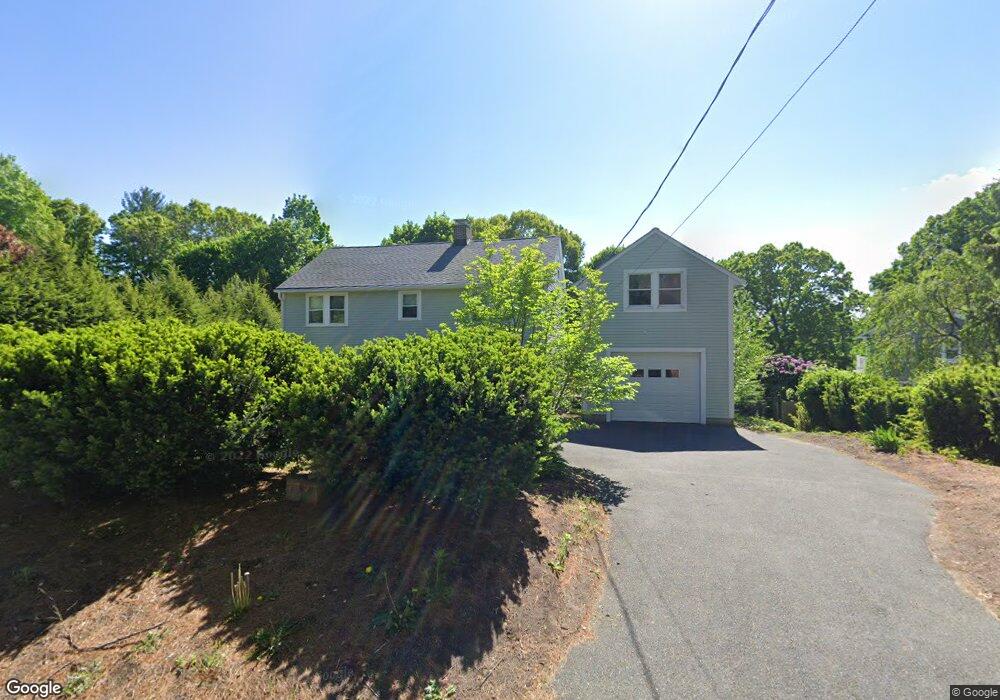
This home is located at 15 Walnut St, Lynnfield, MA 01940 and is currently estimated at $2,872,695, approximately $366 per square foot. 15 Walnut St is a home located in Essex County with nearby schools including Pickering Middle School, Lynnfield High School, and Odyssey Day School.
Ownership History
Date
Name
Owned For
Owner Type
Purchase Details
Closed on
Nov 30, 2009
Sold by
Ne Heritage Prop Corp
Bought by
Solimine Paul J
Current Estimated Value
Home Financials for this Owner
Home Financials are based on the most recent Mortgage that was taken out on this home.
Original Mortgage
$450,000
Outstanding Balance
$293,817
Interest Rate
4.92%
Mortgage Type
Purchase Money Mortgage
Estimated Equity
$2,578,878
Purchase Details
Closed on
Mar 20, 2009
Sold by
Betterbuilt Constr Llc
Bought by
Ne Heritage Prop Corp
Purchase Details
Closed on
Oct 11, 2006
Sold by
Mcquillin Brian R and Reiss Christian F
Bought by
Betterbuilt Constr Llc
Home Financials for this Owner
Home Financials are based on the most recent Mortgage that was taken out on this home.
Original Mortgage
$1,250,000
Interest Rate
6.47%
Mortgage Type
Purchase Money Mortgage
Purchase Details
Closed on
Sep 30, 2005
Sold by
Kelloway George H and Kelloway Joan S
Bought by
Mcquillin Brian R and Reiss Christian F
Create a Home Valuation Report for This Property
The Home Valuation Report is an in-depth analysis detailing your home's value as well as a comparison with similar homes in the area
Home Values in the Area
Average Home Value in this Area
Purchase History
| Date | Buyer | Sale Price | Title Company |
|---|---|---|---|
| Solimine Paul J | $1,250,000 | -- | |
| Ne Heritage Prop Corp | $1,250,000 | -- | |
| Betterbuilt Constr Llc | -- | -- | |
| Mcquillin Brian R | $515,000 | -- |
Source: Public Records
Mortgage History
| Date | Status | Borrower | Loan Amount |
|---|---|---|---|
| Open | Mcquillin Brian R | $450,000 | |
| Previous Owner | Mcquillin Brian R | $1,250,000 |
Source: Public Records
Tax History Compared to Growth
Tax History
| Year | Tax Paid | Tax Assessment Tax Assessment Total Assessment is a certain percentage of the fair market value that is determined by local assessors to be the total taxable value of land and additions on the property. | Land | Improvement |
|---|---|---|---|---|
| 2025 | $22,254 | $2,107,400 | $526,400 | $1,581,000 |
| 2024 | $21,931 | $2,086,700 | $518,600 | $1,568,100 |
| 2023 | $21,228 | $1,878,600 | $446,800 | $1,431,800 |
| 2022 | $20,016 | $1,669,400 | $424,100 | $1,245,300 |
| 2021 | $17,755 | $1,338,000 | $354,100 | $983,900 |
| 2020 | $17,972 | $1,291,100 | $300,900 | $990,200 |
| 2019 | $17,726 | $1,274,300 | $284,100 | $990,200 |
| 2018 | $17,534 | $1,274,300 | $284,100 | $990,200 |
| 2017 | $16,382 | $1,188,800 | $266,600 | $922,200 |
| 2016 | $15,266 | $1,052,800 | $261,400 | $791,400 |
| 2015 | $13,954 | $963,000 | $260,700 | $702,300 |
Source: Public Records
Map
Nearby Homes