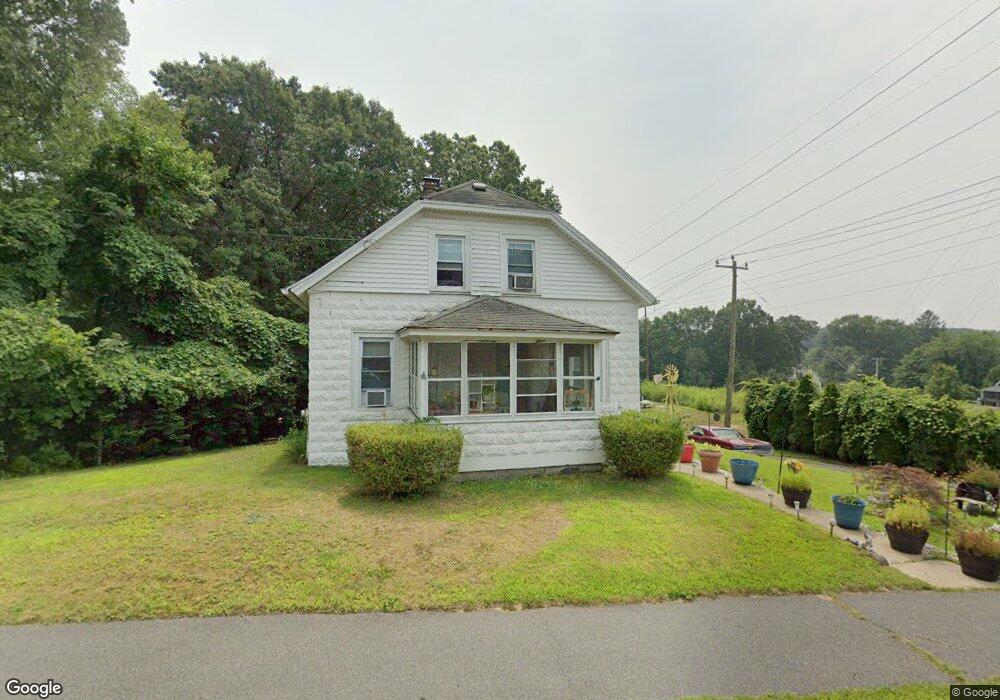
15 West Ave Ludlow, MA 01056
Estimated Value: $262,000 - $564,000
3
Beds
1
Bath
1,296
Sq Ft
$269/Sq Ft
Est. Value
About This Home
This home is located at 15 West Ave, Ludlow, MA 01056 and is currently estimated at $348,744, approximately $269 per square foot. 15 West Ave is a home located in Hampden County with nearby schools including East Street Elementary School, Chapin Street Elementary School, and Paul R. Baird Middle School.
Ownership History
Date
Name
Owned For
Owner Type
Purchase Details
Closed on
Sep 12, 2012
Sold by
Wikar Charles M
Bought by
Klm West End Dev Llc
Current Estimated Value
Purchase Details
Closed on
Apr 27, 2000
Sold by
Gow James D and Olen James B
Bought by
Krynicki Kenneth
Create a Home Valuation Report for This Property
The Home Valuation Report is an in-depth analysis detailing your home's value as well as a comparison with similar homes in the area
Home Values in the Area
Average Home Value in this Area
Purchase History
| Date | Buyer | Sale Price | Title Company |
|---|---|---|---|
| Klm West End Dev Llc | $100,000 | -- | |
| Klm West End Dev Llc | $100,000 | -- | |
| Klm West End Dev Llc | $100,000 | -- | |
| Klm West End Dev Llc | $100,000 | -- | |
| Krynicki Kenneth | $12,500 | -- | |
| Krynicki Kenneth | $12,500 | -- | |
| Krynicki Kenneth | $12,500 | -- | |
| Krynicki Kenneth | $12,500 | -- |
Source: Public Records
Tax History
| Year | Tax Paid | Tax Assessment Tax Assessment Total Assessment is a certain percentage of the fair market value that is determined by local assessors to be the total taxable value of land and additions on the property. | Land | Improvement |
|---|---|---|---|---|
| 2025 | $3,647 | $210,200 | $36,600 | $173,600 |
| 2024 | $3,461 | $191,300 | $36,500 | $154,800 |
| 2023 | $3,182 | $163,100 | $30,300 | $132,800 |
| 2022 | $2,973 | $148,700 | $30,300 | $118,400 |
| 2021 | $2,941 | $139,500 | $30,300 | $109,200 |
| 2020 | $2,815 | $136,500 | $29,900 | $106,600 |
| 2019 | $2,604 | $131,400 | $29,600 | $101,800 |
| 2018 | $2,424 | $127,500 | $29,600 | $97,900 |
| 2017 | $2,311 | $124,700 | $30,100 | $94,600 |
| 2016 | $2,217 | $122,300 | $31,300 | $91,000 |
| 2015 | -- | $101,100 | $31,000 | $70,100 |
Source: Public Records
Map
Nearby Homes
- 76 Hampden St
- 175 Fiberloid St
- 28 Mockingbird Dr
- 295 Main St
- 0 N S Main St Io
- 36 Daniel St
- 96 Lyons St
- 145 Moxon St
- 46-48 Milton St
- 33 Connolly St
- 64-66 Ferris St
- 9 Post Rd
- 39 Rogers Ave
- 21 Wrona St
- 350 West Ave Unit 5
- 1019 Burnett Rd
- 0 Center St Unit 73415933
- 93 Grochmal Ave Unit 12
- 140 Temby St
- 88 Basil Rd
Your Personal Tour Guide
Ask me questions while you tour the home.