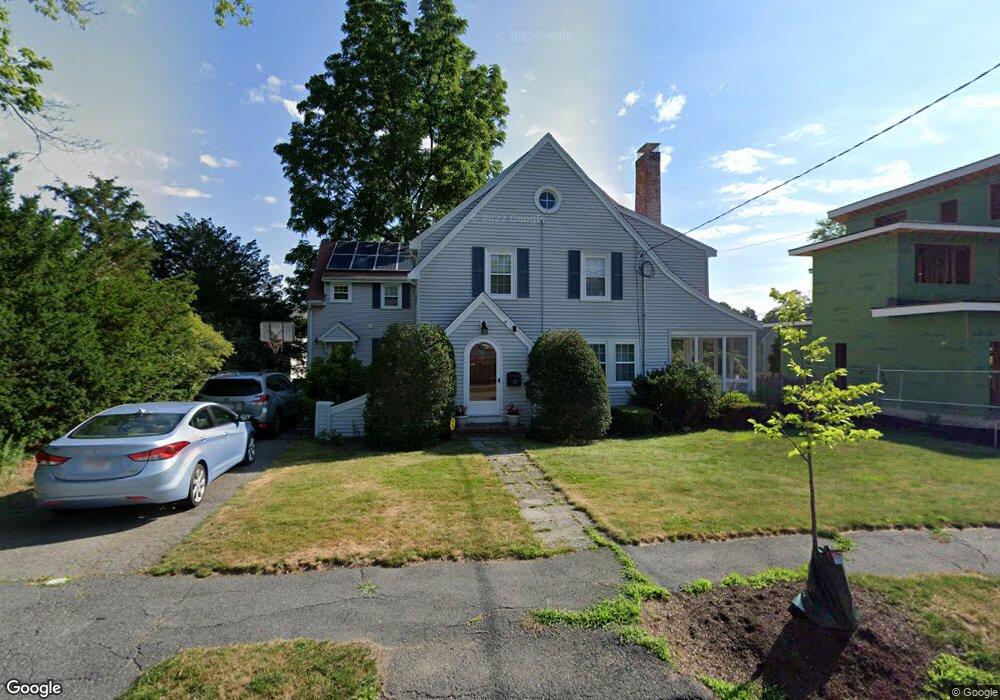
15 Whittlesey Rd Newton Center, MA 02459
Oak Hill NeighborhoodEstimated Value: $1,652,000 - $1,778,000
4
Beds
3
Baths
2,816
Sq Ft
$615/Sq Ft
Est. Value
About This Home
This home is located at 15 Whittlesey Rd, Newton Center, MA 02459 and is currently estimated at $1,730,976, approximately $614 per square foot. 15 Whittlesey Rd is a home located in Middlesex County with nearby schools including Countryside Elementary School, Charles E Brown Middle School, and Newton South High School.
Ownership History
Date
Name
Owned For
Owner Type
Purchase Details
Closed on
Jul 13, 2015
Sold by
Marcus Saul R and Marcus Beverly B
Bought by
Beverly Baron Marcus R
Current Estimated Value
Purchase Details
Closed on
Feb 1, 1984
Bought by
Baron Beverly M and Marcus Saul R
Create a Home Valuation Report for This Property
The Home Valuation Report is an in-depth analysis detailing your home's value as well as a comparison with similar homes in the area
Home Values in the Area
Average Home Value in this Area
Purchase History
| Date | Buyer | Sale Price | Title Company |
|---|---|---|---|
| Beverly Baron Marcus R | -- | -- | |
| Baron Beverly M | $145,000 | -- |
Source: Public Records
Mortgage History
| Date | Status | Borrower | Loan Amount |
|---|---|---|---|
| Previous Owner | Baron Beverly M | $100,000 | |
| Previous Owner | Baron Beverly M | $75,000 | |
| Previous Owner | Baron Beverly M | $50,000 |
Source: Public Records
Tax History Compared to Growth
Tax History
| Year | Tax Paid | Tax Assessment Tax Assessment Total Assessment is a certain percentage of the fair market value that is determined by local assessors to be the total taxable value of land and additions on the property. | Land | Improvement |
|---|---|---|---|---|
| 2025 | $14,296 | $1,458,800 | $965,100 | $493,700 |
| 2024 | $13,823 | $1,416,300 | $937,000 | $479,300 |
| 2023 | $13,272 | $1,303,700 | $714,200 | $589,500 |
| 2022 | $12,699 | $1,207,100 | $661,300 | $545,800 |
| 2021 | $12,253 | $1,138,800 | $623,900 | $514,900 |
| 2020 | $11,889 | $1,138,800 | $623,900 | $514,900 |
| 2019 | $11,554 | $1,105,600 | $605,700 | $499,900 |
| 2018 | $11,092 | $1,025,100 | $556,000 | $469,100 |
| 2017 | $10,754 | $967,100 | $524,500 | $442,600 |
| 2016 | $10,285 | $903,800 | $490,200 | $413,600 |
| 2015 | $9,805 | $844,500 | $458,100 | $386,400 |
Source: Public Records
Map
Nearby Homes
- 58 Country Club Rd
- 415 Dedham St Unit D
- 45 Brandeis Rd
- 15 Buff Cir
- 36 Cannon St
- 65 Levbert Rd
- 250 Woodcliff Rd
- 19 Selwyn Rd
- 35 Haynes Rd
- 41 Juniper Ln
- 21 Philbrick Rd
- 135 Hartman Rd
- 59 Deborah Rd
- 628 Boylston St
- 56 Cynthia Rd
- 125 Oakdale Rd
- 1308 Walnut St
- 671 Boylston St
- 625 Boylston St
- 85 Dudley Rd