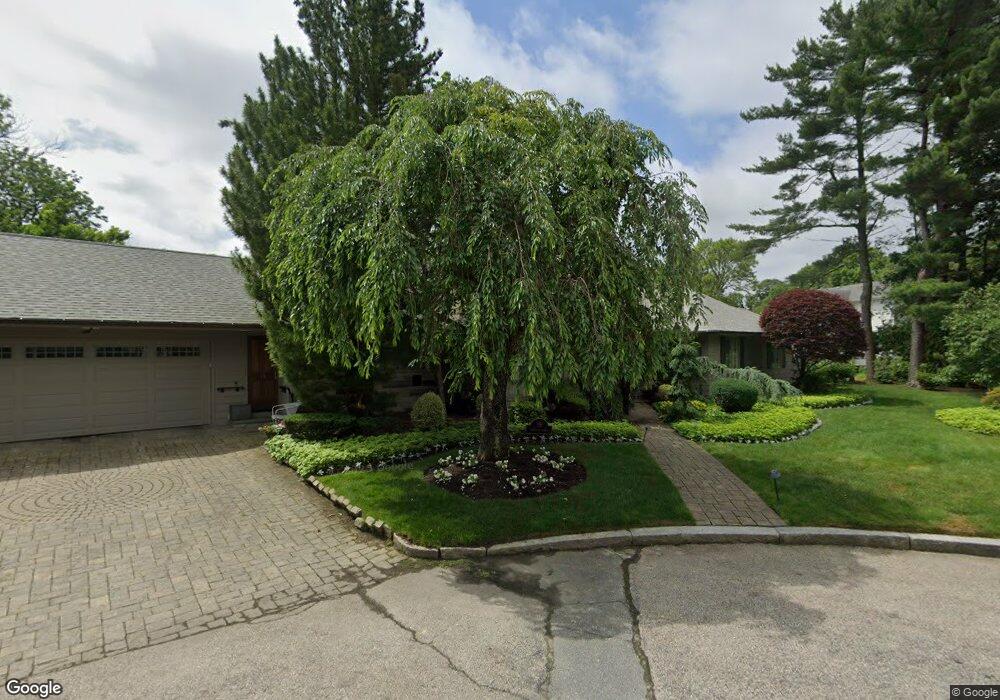
15 Winfield Ct Providence, RI 02906
Blackstone NeighborhoodEstimated Value: $1,445,388 - $1,571,000
4
Beds
4
Baths
3,090
Sq Ft
$488/Sq Ft
Est. Value
About This Home
This home is located at 15 Winfield Ct, Providence, RI 02906 and is currently estimated at $1,506,463, approximately $487 per square foot. 15 Winfield Ct is a home located in Providence County with nearby schools including Asa Messer Elementary School, Charles N. Fortes Elementary School, and Veazie Street Elementary School.
Ownership History
Date
Name
Owned For
Owner Type
Purchase Details
Closed on
May 3, 2019
Sold by
Rubinstein Michael and Rubinstein Linda
Bought by
Linda Rubinstein Ret
Current Estimated Value
Purchase Details
Closed on
Sep 23, 2015
Sold by
Rubinstein Linda and Rubinstein Michael
Bought by
Linda Rubinstein Ret
Home Financials for this Owner
Home Financials are based on the most recent Mortgage that was taken out on this home.
Original Mortgage
$493,050
Interest Rate
3%
Mortgage Type
Adjustable Rate Mortgage/ARM
Purchase Details
Closed on
Oct 16, 2002
Sold by
Samdperil Alan M and Samdperil Sandra C
Bought by
Rubinstein Michael L and Rubinstein Linda H
Create a Home Valuation Report for This Property
The Home Valuation Report is an in-depth analysis detailing your home's value as well as a comparison with similar homes in the area
Home Values in the Area
Average Home Value in this Area
Purchase History
| Date | Buyer | Sale Price | Title Company |
|---|---|---|---|
| Linda Rubinstein Ret | -- | -- | |
| Rubinstein Michael | -- | -- | |
| Linda Rubinstein Ret | -- | -- | |
| Rubinstein Linda | -- | -- | |
| Rubinstein Michael L | $863,000 | -- |
Source: Public Records
Mortgage History
| Date | Status | Borrower | Loan Amount |
|---|---|---|---|
| Previous Owner | Rubinstein Linda | $493,050 | |
| Previous Owner | Rubinstein Michael L | $413,400 | |
| Previous Owner | Rubinstein Michael L | $475,000 | |
| Previous Owner | Rubinstein Michael L | $600,000 |
Source: Public Records
Tax History Compared to Growth
Tax History
| Year | Tax Paid | Tax Assessment Tax Assessment Total Assessment is a certain percentage of the fair market value that is determined by local assessors to be the total taxable value of land and additions on the property. | Land | Improvement |
|---|---|---|---|---|
| 2025 | $11,462 | $1,364,500 | $840,600 | $523,900 |
| 2024 | $15,999 | $871,900 | $418,200 | $453,700 |
| 2023 | $15,999 | $871,900 | $418,200 | $453,700 |
| 2022 | $15,520 | $871,900 | $418,200 | $453,700 |
| 2021 | $16,991 | $691,800 | $324,100 | $367,700 |
| 2020 | $16,991 | $691,800 | $324,100 | $367,700 |
| 2019 | $16,991 | $691,800 | $324,100 | $367,700 |
| 2018 | $25,498 | $797,800 | $278,300 | $519,500 |
| 2017 | $25,498 | $797,800 | $278,300 | $519,500 |
| 2016 | $25,498 | $797,800 | $278,300 | $519,500 |
| 2015 | $25,927 | $783,300 | $294,600 | $488,700 |
| 2014 | $26,237 | $777,400 | $294,600 | $482,800 |
| 2013 | $26,237 | $777,400 | $294,600 | $482,800 |
Source: Public Records
Map
Nearby Homes
- 750 Elmgrove Ave
- 767 Elmgrove Ave
- 540 Blackstone Blvd
- 62 Harwich Rd
- 132 11th St
- 873 Hope St
- 41 Wingate Rd
- 151 Chace Ave
- 172 Chace Ave
- 141 Hillside Ave
- 136 Hillside Ave
- 436 Blackstone Blvd
- 142 Ridge St
- 122 Lowden St
- 32 Glendale Ave
- 32 Carver St
- 640 East Ave
- 202 Rochambeau Ave Unit 2
- 603 East Ave
- 89 Dexterdale Rd
- 194 Lorimer Ave
- 11 Winfield Ct
- 200 Lorimer Ave
- 40 Winfield Rd
- 32 Winfield Rd
- 23 Winfield Ct
- 220 Lorimer Ave
- 5 Winfield Ct
- 30 Winfield Rd
- 57 Winfield Rd
- 195 Lorimer Ave
- 185 Lorimer Ave
- 6 Winfield Ct
- 80 Hartshorn Rd
- 648 Blackstone Blvd
- 642 Blackstone Blvd
- 55 Winfield Rd
- 640 Blackstone Blvd
- 650 Blackstone Blvd
- 240 8th St