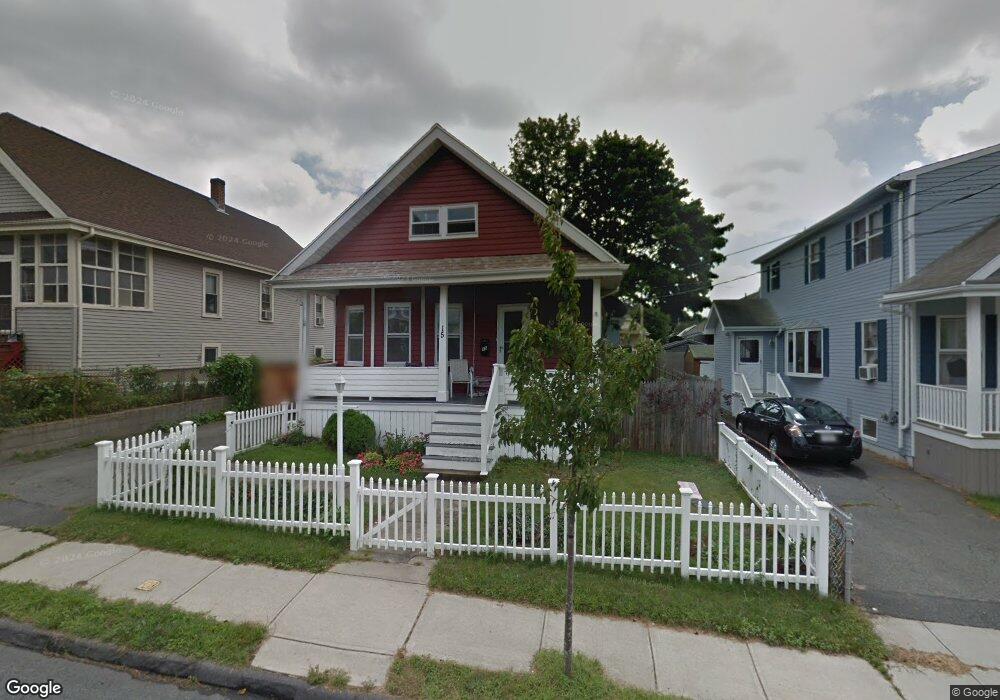
15 Winsor St Fairhaven, MA 02719
North Fairhaven NeighborhoodEstimated Value: $348,000 - $441,000
3
Beds
1
Bath
1,068
Sq Ft
$374/Sq Ft
Est. Value
About This Home
This home is located at 15 Winsor St, Fairhaven, MA 02719 and is currently estimated at $399,909, approximately $374 per square foot. 15 Winsor St is a home located in Bristol County with nearby schools including Fairhaven High School, Alma Del Mar Charter School, and St. Joseph School.
Ownership History
Date
Name
Owned For
Owner Type
Purchase Details
Closed on
Jun 15, 2011
Sold by
Wells Fargo Bank Na
Bought by
Chen Guoxin and Lin Jie M
Current Estimated Value
Purchase Details
Closed on
Mar 29, 2011
Sold by
Picard Kenneth W
Bought by
Wells Fargo Bank
Purchase Details
Closed on
Jun 18, 2004
Sold by
Nogueira Francisco R and Nogueira Naomi M
Bought by
Picard Bethany A and Picard Kenneth W
Purchase Details
Closed on
Jun 5, 2003
Sold by
Davenport Marguerite P
Bought by
Nogueira Francisco R and Nogueira Naomi M
Create a Home Valuation Report for This Property
The Home Valuation Report is an in-depth analysis detailing your home's value as well as a comparison with similar homes in the area
Home Values in the Area
Average Home Value in this Area
Purchase History
| Date | Buyer | Sale Price | Title Company |
|---|---|---|---|
| Chen Guoxin | $118,000 | -- | |
| Wells Fargo Bank | $176,170 | -- | |
| Picard Bethany A | $215,000 | -- | |
| Nogueira Francisco R | $170,000 | -- |
Source: Public Records
Mortgage History
| Date | Status | Borrower | Loan Amount |
|---|---|---|---|
| Previous Owner | Nogueira Francisco R | $66,200 | |
| Previous Owner | Nogueira Francisco R | $193,600 | |
| Previous Owner | Nogueira Francisco R | $48,400 |
Source: Public Records
Tax History
| Year | Tax Paid | Tax Assessment Tax Assessment Total Assessment is a certain percentage of the fair market value that is determined by local assessors to be the total taxable value of land and additions on the property. | Land | Improvement |
|---|---|---|---|---|
| 2025 | $31 | $329,300 | $168,600 | $160,700 |
| 2024 | $2,928 | $317,200 | $168,600 | $148,600 |
| 2023 | $2,729 | $274,300 | $147,700 | $126,600 |
| 2022 | $2,655 | $259,800 | $137,300 | $122,500 |
| 2021 | $2,552 | $226,000 | $124,200 | $101,800 |
| 2020 | $2,500 | $226,000 | $124,200 | $101,800 |
| 2019 | $2,313 | $198,200 | $103,000 | $95,200 |
| 2018 | $2,181 | $185,600 | $98,000 | $87,600 |
| 2017 | $2,126 | $176,600 | $98,000 | $78,600 |
| 2016 | $2,200 | $180,600 | $98,000 | $82,600 |
| 2015 | $2,175 | $179,000 | $98,000 | $81,000 |
Source: Public Records
Map
Nearby Homes
Your Personal Tour Guide
Ask me questions while you tour the home.