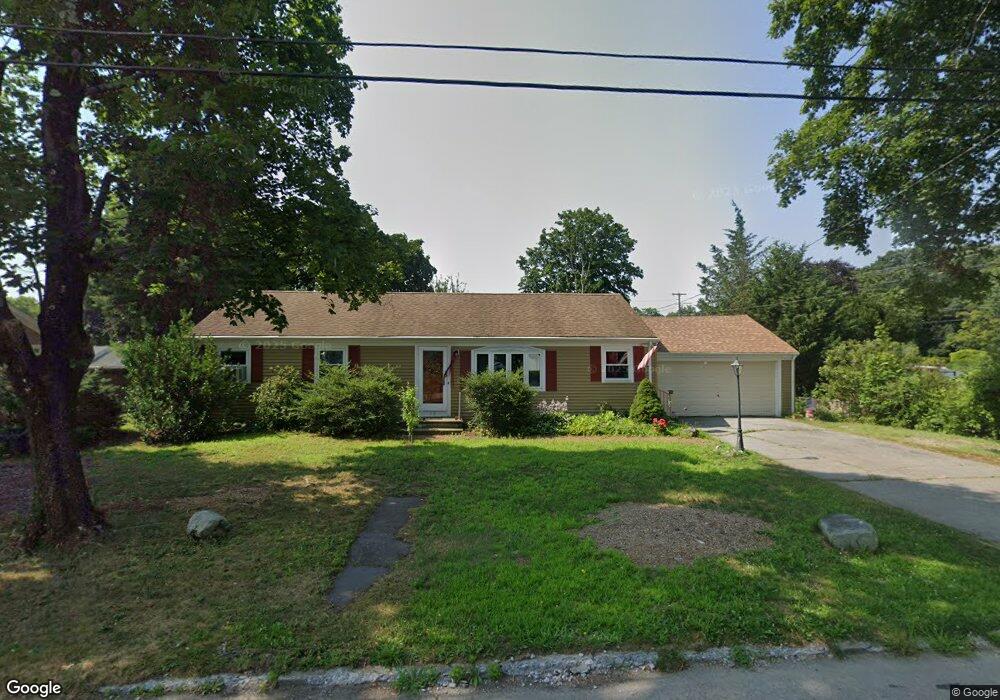
15 Winthrop St Seekonk, MA 02771
Monroes-South Seekonk NeighborhoodEstimated Value: $454,900 - $492,000
2
Beds
1
Bath
2,304
Sq Ft
$202/Sq Ft
Est. Value
About This Home
This home is located at 15 Winthrop St, Seekonk, MA 02771 and is currently estimated at $466,475, approximately $202 per square foot. 15 Winthrop St is a home located in Bristol County with nearby schools including Seekonk High School, St Mary Academy-Bay View, and Providence Country Day School.
Ownership History
Date
Name
Owned For
Owner Type
Purchase Details
Closed on
Jan 31, 1996
Sold by
Oliveira George and Oliveira Mary A
Bought by
Stone Kenneth and Stone Joan
Current Estimated Value
Home Financials for this Owner
Home Financials are based on the most recent Mortgage that was taken out on this home.
Original Mortgage
$70,000
Outstanding Balance
$2,345
Interest Rate
7.25%
Mortgage Type
Purchase Money Mortgage
Estimated Equity
$464,130
Create a Home Valuation Report for This Property
The Home Valuation Report is an in-depth analysis detailing your home's value as well as a comparison with similar homes in the area
Home Values in the Area
Average Home Value in this Area
Purchase History
| Date | Buyer | Sale Price | Title Company |
|---|---|---|---|
| Stone Kenneth | $92,000 | -- |
Source: Public Records
Mortgage History
| Date | Status | Borrower | Loan Amount |
|---|---|---|---|
| Open | Stone Kenneth | $10,000 | |
| Open | Stone Kenneth | $70,000 |
Source: Public Records
Tax History Compared to Growth
Tax History
| Year | Tax Paid | Tax Assessment Tax Assessment Total Assessment is a certain percentage of the fair market value that is determined by local assessors to be the total taxable value of land and additions on the property. | Land | Improvement |
|---|---|---|---|---|
| 2025 | $4,252 | $344,300 | $142,500 | $201,800 |
| 2024 | $4,096 | $331,700 | $142,500 | $189,200 |
| 2023 | $4,004 | $305,400 | $127,300 | $178,100 |
| 2022 | $3,659 | $274,300 | $122,100 | $152,200 |
| 2021 | $3,490 | $257,200 | $108,100 | $149,100 |
| 2020 | $3,383 | $256,900 | $108,000 | $148,900 |
| 2019 | $3,196 | $244,700 | $101,500 | $143,200 |
| 2018 | $3,044 | $228,000 | $98,700 | $129,300 |
| 2017 | $2,945 | $218,800 | $96,300 | $122,500 |
| 2016 | $2,917 | $217,500 | $96,300 | $121,200 |
| 2015 | $2,855 | $215,800 | $96,300 | $119,500 |
Source: Public Records
Map
Nearby Homes
- 0 Mabel Dr
- 454 Fall River Ave
- 7 Jill Ct
- 698 Fall River Ave
- 25 Pimental Dr
- 42 Tee Jay Dr
- 57 Redwood Ln
- 195 Barney Ave
- 6 Hazelton Rd
- 420 Chestnut St
- 5 Connor Ln
- 249 Barneyville Rd
- 22 Mayfield Rd
- 203 Providence St Bldr Lot 5
- 205 Providence St Bldr Lot 3
- 6 Kenmore Ct
- 36 Woodbine St
- 15 George w Finnerty Rd
- 25 Woodbine St
- 127 Mason St