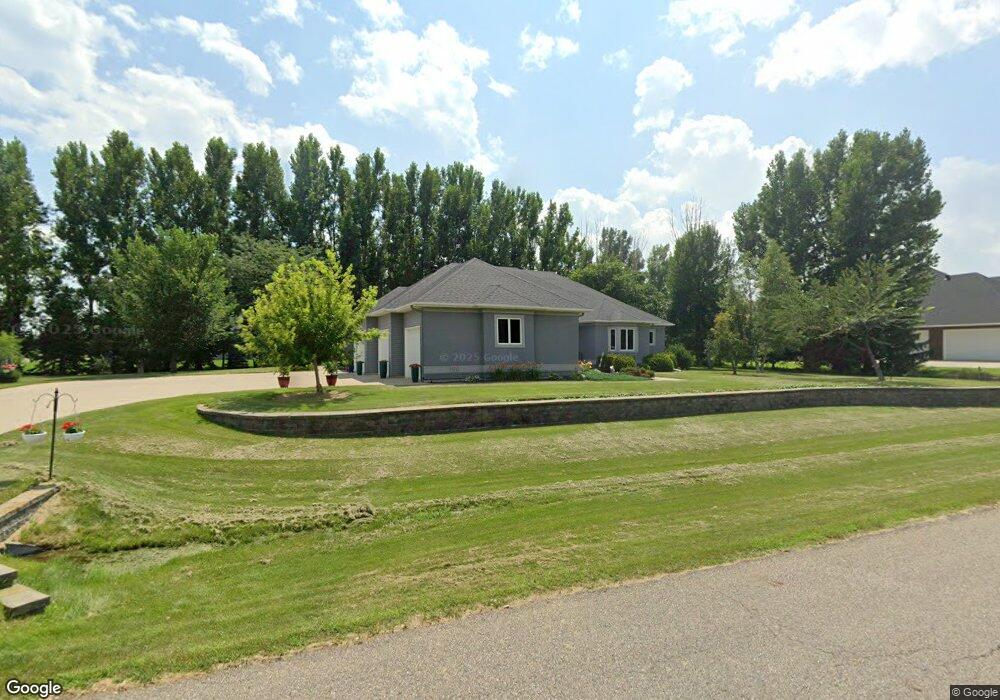
150 49th Ave E West Fargo, ND 58078
McMahon Estates NeighborhoodEstimated Value: $753,000
5
Beds
4
Baths
2,819
Sq Ft
$267/Sq Ft
Est. Value
About This Home
This home is located at 150 49th Ave E, West Fargo, ND 58078 and is currently estimated at $753,000, approximately $267 per square foot. 150 49th Ave E is a home located in Cass County with nearby schools including Liberty Middle School, West Fargo Sheyenne High School, and Trinity Elementary School.
Ownership History
Date
Name
Owned For
Owner Type
Purchase Details
Closed on
Aug 19, 2015
Sold by
Griffin Gene C and Griffin Bonita I
Bought by
Livin Griffin Gene C and Livin Gene C Griffin Revocable
Current Estimated Value
Create a Home Valuation Report for This Property
The Home Valuation Report is an in-depth analysis detailing your home's value as well as a comparison with similar homes in the area
Home Values in the Area
Average Home Value in this Area
Purchase History
| Date | Buyer | Sale Price | Title Company |
|---|---|---|---|
| Livin Griffin Gene C | -- | None Available |
Source: Public Records
Tax History
| Year | Tax Paid | Tax Assessment Tax Assessment Total Assessment is a certain percentage of the fair market value that is determined by local assessors to be the total taxable value of land and additions on the property. | Land | Improvement |
|---|---|---|---|---|
| 2024 | $11,084 | $406,400 | $75,900 | $330,500 |
| 2023 | $10,186 | $371,900 | $58,400 | $313,500 |
| 2022 | $9,694 | $345,350 | $58,400 | $286,950 |
| 2021 | $9,568 | $315,900 | $27,250 | $288,650 |
| 2020 | $8,894 | $297,300 | $27,250 | $270,050 |
| 2019 | $8,702 | $286,550 | $27,250 | $259,300 |
| 2018 | $8,547 | $288,900 | $27,250 | $261,650 |
| 2017 | $8,195 | $282,550 | $27,250 | $255,300 |
| 2016 | $7,663 | $292,600 | $27,250 | $265,350 |
| 2015 | $7,738 | $274,050 | $26,300 | $247,750 |
| 2014 | $7,661 | $256,100 | $26,300 | $229,800 |
| 2013 | $7,457 | $243,500 | $26,300 | $217,200 |
Source: Public Records
Map
Nearby Homes
- 131 49th Ave E
- 106 50th Ave E
- 6152 Wildflower Dr
- 6090 Wildflower Dr S
- 4355 66th St S
- 5861 Wildflower Dr S
- 4195 Furnberg Place S
- 4727 6th St W
- 4615 Beach Ln S Unit 2B
- 6511 Osgood Pkwy S
- 6562 56th Ave S
- 662 Rania Way W
- 5460 11th St W
- 5179 Mira Way W
- 3878 3rd St E
- 729 48th Ave W
- 819 Rania Way W
- 6204 56th Ave S
- 5156 Mira Way
- 5152 Mira Way
Your Personal Tour Guide
Ask me questions while you tour the home.