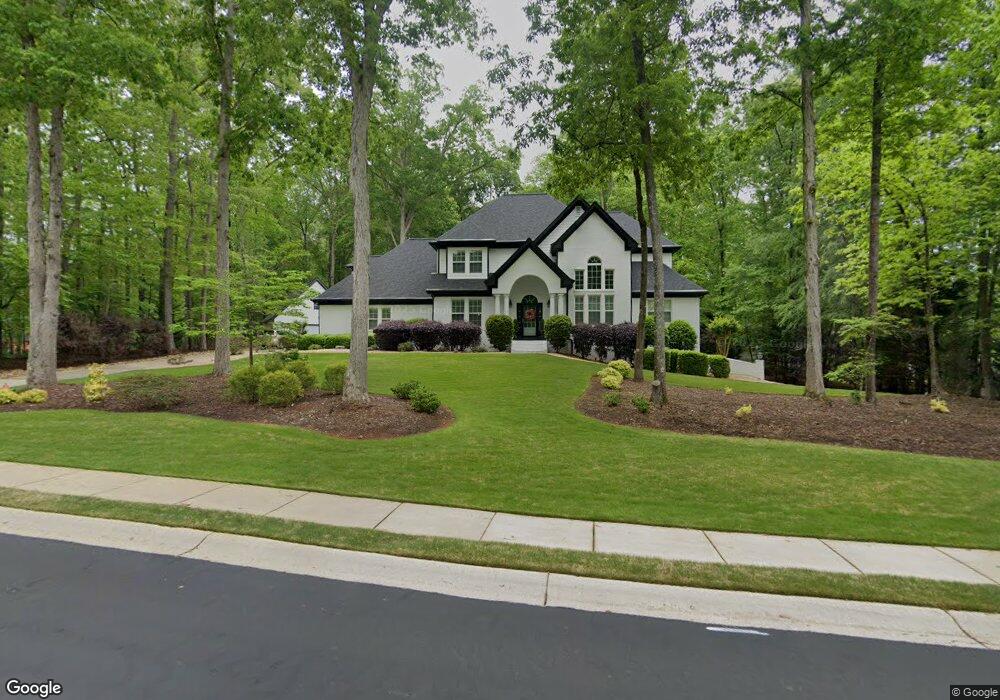
150 Addison Dr Fayetteville, GA 30215
Whitewater NeighborhoodEstimated Value: $731,000 - $847,000
4
Beds
4
Baths
3,227
Sq Ft
$244/Sq Ft
Est. Value
About This Home
This home is located at 150 Addison Dr, Fayetteville, GA 30215 and is currently estimated at $785,791, approximately $243 per square foot. 150 Addison Dr is a home located in Fayette County with nearby schools including Sara Harp Minter Elementary School, Whitewater Middle School, and Whitewater High School.
Ownership History
Date
Name
Owned For
Owner Type
Purchase Details
Closed on
Jul 29, 2020
Sold by
Fry Matthew
Bought by
Crawford Anthony J and Crawford Becky
Current Estimated Value
Home Financials for this Owner
Home Financials are based on the most recent Mortgage that was taken out on this home.
Original Mortgage
$415,200
Outstanding Balance
$368,312
Interest Rate
3%
Mortgage Type
New Conventional
Estimated Equity
$417,479
Purchase Details
Closed on
Oct 27, 2016
Sold by
James
Bought by
Fry Matthew and Fry Tiffany
Home Financials for this Owner
Home Financials are based on the most recent Mortgage that was taken out on this home.
Original Mortgage
$450,786
Interest Rate
3.42%
Mortgage Type
Stand Alone Refi Refinance Of Original Loan
Purchase Details
Closed on
Feb 21, 2006
Sold by
Pebble Hill Homes Inc
Bought by
Tarpley James M and Tarpley Michelle L
Home Financials for this Owner
Home Financials are based on the most recent Mortgage that was taken out on this home.
Original Mortgage
$400,000
Interest Rate
6.04%
Mortgage Type
New Conventional
Create a Home Valuation Report for This Property
The Home Valuation Report is an in-depth analysis detailing your home's value as well as a comparison with similar homes in the area
Home Values in the Area
Average Home Value in this Area
Purchase History
| Date | Buyer | Sale Price | Title Company |
|---|---|---|---|
| Crawford Anthony J | $519,000 | -- | |
| Fry Matthew | $467,500 | -- | |
| Tarpley James M | $502,000 | -- |
Source: Public Records
Mortgage History
| Date | Status | Borrower | Loan Amount |
|---|---|---|---|
| Open | Crawford Anthony J | $415,200 | |
| Previous Owner | Fry Matthew | $450,786 | |
| Previous Owner | Tarpley James M | $400,000 |
Source: Public Records
Tax History Compared to Growth
Tax History
| Year | Tax Paid | Tax Assessment Tax Assessment Total Assessment is a certain percentage of the fair market value that is determined by local assessors to be the total taxable value of land and additions on the property. | Land | Improvement |
|---|---|---|---|---|
| 2024 | $6,710 | $297,500 | $46,400 | $251,100 |
| 2023 | $5,916 | $241,320 | $46,400 | $194,920 |
| 2022 | $5,582 | $216,720 | $46,400 | $170,320 |
| 2021 | $5,449 | $204,980 | $35,700 | $169,280 |
| 2020 | $5,417 | $192,020 | $35,700 | $156,320 |
| 2019 | $5,375 | $188,540 | $35,700 | $152,840 |
| 2018 | $5,164 | $179,180 | $35,700 | $143,480 |
| 2017 | $5,184 | $179,180 | $35,700 | $143,480 |
| 2016 | $4,500 | $179,180 | $35,700 | $143,480 |
| 2015 | $5,008 | $166,340 | $35,700 | $130,640 |
| 2014 | $4,677 | $152,760 | $37,800 | $114,960 |
| 2013 | -- | $142,980 | $0 | $0 |
Source: Public Records
Map
Nearby Homes
- 410 Fitzgerald Ln
- 462 Snead Rd Unit 2
- 643 Old Greenville Rd
- 125 Gladys Ln
- 164 Snead Rd
- 105 Jay Trail
- 125 Jay Trail
- 140 Olivia Ct
- BETWEEN 366 & 4 Antioch Rd
- 105 Sweet Briar Trail
- 300 Wrightsburg Ct
- 836 Old Greenville Rd
- 240 Jay Trail
- 200 Providence Rd
- 120 Broad Meadows Ln
- 135 Acton Dr
- 0 Chappell Rd Unit 7561060
- 0 Chappell Rd Unit 10501594
- 165 & 175 Shamrock Dr
- 215 Watershed Way
- 460 Fitzgerald Ln
- 460 Fitzgerald Ln Unit 65
- 170 Addison Dr Unit 67
- 170 Addison Dr
- 145 Addison Dr
- 200 Addison Dr
- 155 Addison Dr
- 155 Addison Dr Unit 54
- 440 Fitzgerald Ln
- 165 Addison Dr
- 210 Addison Dr
- 175 Addison Dr
- 195 Addison Dr
- 430 Fitzgerald Ln
- 430 Fitzgerald Ln Unit 63
- 185 Addison Dr
- 220 Addison Dr
- 205 Addison Dr
- 135 Addison Dr
- 420 Fitzgerald Ln