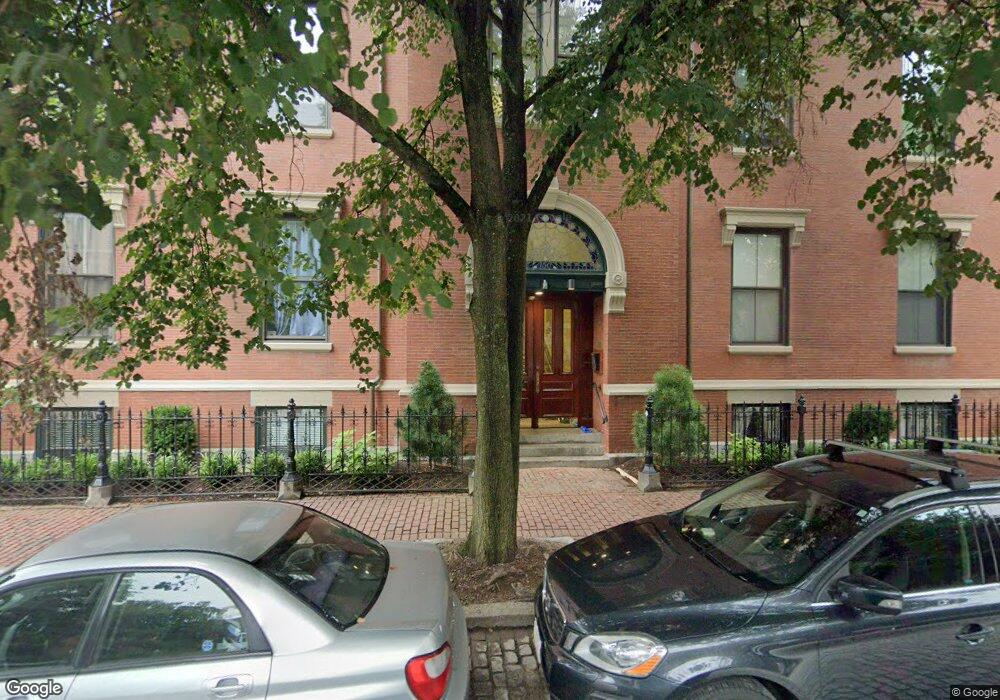
150 Appleton St Unit 5B Boston, MA 02116
South End NeighborhoodEstimated Value: $1,420,000 - $1,829,000
2
Beds
2
Baths
1,290
Sq Ft
$1,311/Sq Ft
Est. Value
About This Home
This home is located at 150 Appleton St Unit 5B, Boston, MA 02116 and is currently estimated at $1,691,276, approximately $1,311 per square foot. 150 Appleton St Unit 5B is a home located in Suffolk County with nearby schools including Kingsley Montessori School and Cathedral High School.
Ownership History
Date
Name
Owned For
Owner Type
Purchase Details
Closed on
Jun 15, 2007
Sold by
National Residential N
Bought by
Gilula Jonathan E
Current Estimated Value
Home Financials for this Owner
Home Financials are based on the most recent Mortgage that was taken out on this home.
Original Mortgage
$796,500
Outstanding Balance
$487,374
Interest Rate
6.19%
Mortgage Type
Purchase Money Mortgage
Estimated Equity
$1,203,902
Purchase Details
Closed on
Jun 17, 2003
Sold by
Leabman Jacqueline Est
Bought by
Prince Douglas S and Prince Diana M
Home Financials for this Owner
Home Financials are based on the most recent Mortgage that was taken out on this home.
Original Mortgage
$544,000
Interest Rate
5.77%
Mortgage Type
Purchase Money Mortgage
Create a Home Valuation Report for This Property
The Home Valuation Report is an in-depth analysis detailing your home's value as well as a comparison with similar homes in the area
Home Values in the Area
Average Home Value in this Area
Purchase History
| Date | Buyer | Sale Price | Title Company |
|---|---|---|---|
| Gilula Jonathan E | $885,000 | -- | |
| Mass Residential Nt Sv | $885,000 | -- | |
| Gilula Jonathan E | $885,000 | -- | |
| Mass Residential Nt Sv | $885,000 | -- | |
| Prince Douglas S | $680,000 | -- |
Source: Public Records
Mortgage History
| Date | Status | Borrower | Loan Amount |
|---|---|---|---|
| Open | Prince Douglas S | $523,750 | |
| Open | Gilula Jonathan E | $796,500 | |
| Closed | Mass Residential Nt Sv | $796,500 | |
| Previous Owner | Prince Douglas S | $544,000 |
Source: Public Records
Tax History
| Year | Tax Paid | Tax Assessment Tax Assessment Total Assessment is a certain percentage of the fair market value that is determined by local assessors to be the total taxable value of land and additions on the property. | Land | Improvement |
|---|---|---|---|---|
| 2025 | $17,792 | $1,536,400 | $0 | $1,536,400 |
| 2024 | $16,106 | $1,477,600 | $0 | $1,477,600 |
| 2023 | $15,400 | $1,433,900 | $0 | $1,433,900 |
| 2022 | $14,859 | $1,365,700 | $0 | $1,365,700 |
| 2021 | $14,572 | $1,365,700 | $0 | $1,365,700 |
| 2020 | $14,628 | $1,385,200 | $0 | $1,385,200 |
| 2019 | $14,175 | $1,344,900 | $0 | $1,344,900 |
| 2018 | $13,830 | $1,319,700 | $0 | $1,319,700 |
| 2017 | $13,189 | $1,245,400 | $0 | $1,245,400 |
| 2016 | $13,173 | $1,197,500 | $0 | $1,197,500 |
| 2015 | $12,973 | $1,071,300 | $0 | $1,071,300 |
| 2014 | $12,369 | $983,200 | $0 | $983,200 |
Source: Public Records
Map
Nearby Homes
- 370 Columbus Ave Unit B
- 350 Columbus Ave Unit 6
- 171 Warren Ave Unit 5
- 6 Yarmouth St Unit 3
- 150 Chandler St Unit 9
- 5 Dartmouth Place
- 109 Appleton St
- 30 Dartmouth St Unit 3
- 158 W Canton St
- 29 Holyoke St Unit 1
- 118 Chandler St Unit 2
- 303 Columbus Ave Unit 501
- 128 Pembroke St Unit 2-3
- 42 Clarendon St Unit 1
- 70 Clarendon St Unit 1
- 2 Clarendon St Unit 204
- 87 Pembroke St
- 53 Clarendon St Unit 3
- 667 Tremont St Unit PH
- 285 Columbus Ave Unit 805
- 150 Appleton St Unit 5A
- 150 Appleton St Unit 4E
- 150 Appleton St Unit 4D
- 150 Appleton St Unit 4C
- 150 Appleton St Unit 4B
- 150 Appleton St Unit 4A
- 150 Appleton St Unit 3E
- 150 Appleton St Unit 3D
- 150 Appleton St Unit 3C
- 150 Appleton St Unit 3B
- 150 Appleton St Unit 3A
- 150 Appleton St Unit 2E
- 150 Appleton St Unit 2D
- 150 Appleton St Unit 2C
- 150 Appleton St Unit 2B
- 150 Appleton St Unit 1E
- 150 Appleton St Unit 1D
- 150 Appleton St Unit 1C
- 150 Appleton St Unit 1B
- 150 Appleton St Unit 1A
Your Personal Tour Guide
Ask me questions while you tour the home.