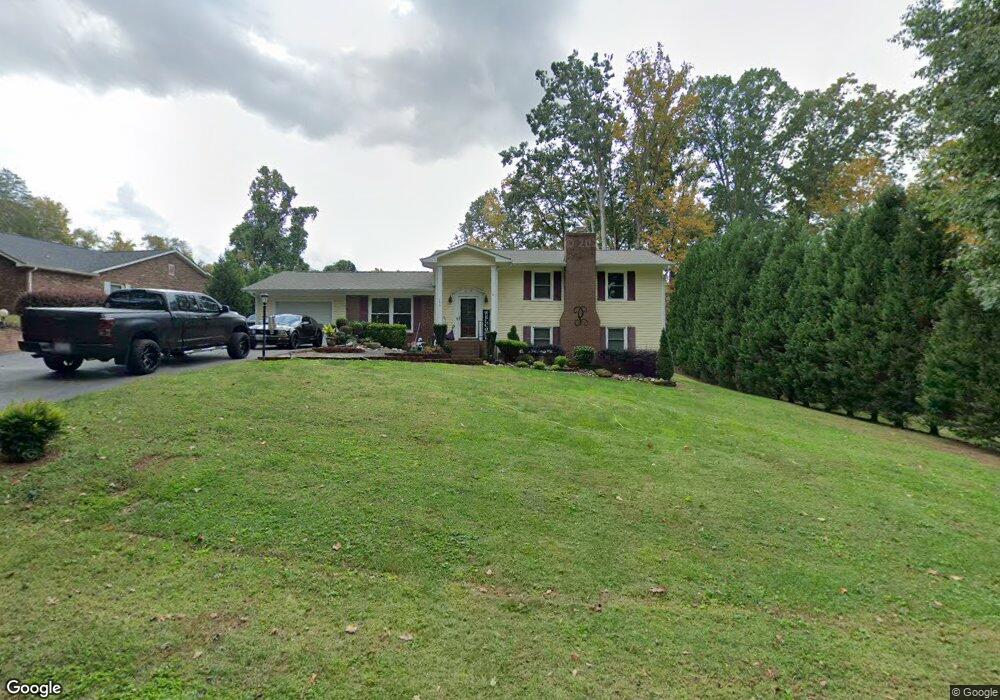
150 Camelot Rd Salisbury, NC 28147
Estimated Value: $264,000 - $320,000
4
Beds
3
Baths
1,996
Sq Ft
$150/Sq Ft
Est. Value
About This Home
This home is located at 150 Camelot Rd, Salisbury, NC 28147 and is currently estimated at $298,854, approximately $149 per square foot. 150 Camelot Rd is a home located in Rowan County with nearby schools including Knollwood Elementary School, Southeast Middle School, and Salisbury High School.
Ownership History
Date
Name
Owned For
Owner Type
Purchase Details
Closed on
Apr 28, 2010
Sold by
D P Family Trust
Bought by
Parks Bobby T and Parks Lakisha M
Current Estimated Value
Home Financials for this Owner
Home Financials are based on the most recent Mortgage that was taken out on this home.
Original Mortgage
$123,677
Outstanding Balance
$83,704
Interest Rate
5.25%
Mortgage Type
FHA
Estimated Equity
$215,150
Purchase Details
Closed on
Oct 6, 2009
Sold by
Secretary Of Housing & Urban Development
Bought by
D P Family Trust
Purchase Details
Closed on
Mar 20, 2009
Sold by
Wells Fargo Bank Na
Bought by
Secretary Of Housing & Urban Development
Purchase Details
Closed on
Mar 1, 2009
Sold by
Gbunblee Acquilla and Gbunblee Hilary F
Bought by
Wells Fargo Bank Na
Create a Home Valuation Report for This Property
The Home Valuation Report is an in-depth analysis detailing your home's value as well as a comparison with similar homes in the area
Home Values in the Area
Average Home Value in this Area
Purchase History
| Date | Buyer | Sale Price | Title Company |
|---|---|---|---|
| Parks Bobby T | $126,000 | None Available | |
| D P Family Trust | -- | None Available | |
| Secretary Of Housing & Urban Development | -- | None Available | |
| Wells Fargo Bank Na | $124,156 | None Available |
Source: Public Records
Mortgage History
| Date | Status | Borrower | Loan Amount |
|---|---|---|---|
| Open | Parks Bobby T | $123,677 |
Source: Public Records
Tax History Compared to Growth
Tax History
| Year | Tax Paid | Tax Assessment Tax Assessment Total Assessment is a certain percentage of the fair market value that is determined by local assessors to be the total taxable value of land and additions on the property. | Land | Improvement |
|---|---|---|---|---|
| 2025 | $2,612 | $218,397 | $28,500 | $189,897 |
| 2024 | $2,612 | $218,397 | $28,500 | $189,897 |
| 2023 | $2,612 | $218,397 | $28,500 | $189,897 |
| 2022 | $2,066 | $149,993 | $22,500 | $127,493 |
| 2021 | $2,066 | $149,993 | $22,500 | $127,493 |
| 2020 | $2,066 | $149,993 | $22,500 | $127,493 |
| 2019 | $2,066 | $149,993 | $22,500 | $127,493 |
| 2018 | $1,759 | $129,438 | $22,500 | $106,938 |
| 2017 | $1,749 | $129,438 | $22,500 | $106,938 |
| 2016 | $1,701 | $129,438 | $22,500 | $106,938 |
| 2015 | $1,712 | $129,438 | $22,500 | $106,938 |
| 2014 | $1,665 | $127,433 | $22,500 | $104,933 |
Source: Public Records
Map
Nearby Homes
- 201 Bayberry Dr
- 202 Bayberry Dr
- 1297 Rachel Ln
- 1277 Rachel Ln
- 294 Village Creek Way
- 701 Airport Rd
- 1084 Rachel Ln
- 1066 Rachel Ln
- 1011 Rachel Ln
- 308 Hickory Ln
- 240 Partridge Run
- 322 W Glenview Dr
- 325 Bob White Run
- 335 Bonaventure Dr
- 102 Wyndham Way
- 325 Bonaventure Dr
- 290 Roger Dr
- 255 Quail Dr
- 280 Bonaventure Dr
- 103 Chalfont Ct
- 160 Camelot Rd
- 130 Camelot Rd
- 240 Camelot Rd
- 125 Camelot Rd
- 155 Camelot Rd
- 301 Bayberry Dr
- 245 Camelot Rd
- 207 Bayberry Dr
- 0 Camelot Rd
- 205 Bayberry Dr
- 255 Camelot Rd
- 203 Bayberry Dr
- 105 Lancelot Rd
- 103 Lancelot Rd
- 280 Camelot Rd
- 107 Lancelot Rd
- 302 Bayberry Dr
- 275 Camelot Rd
- Lot 3 Bayberry Dr
- 310 Camelot Rd