150 Cedar Point Cir Cordele, GA 31015
Estimated Value: $840,000 - $1,034,000
4
Beds
4
Baths
2,713
Sq Ft
$350/Sq Ft
Est. Value
About This Home
This home is located at 150 Cedar Point Cir, Cordele, GA 31015 and is currently estimated at $949,921, approximately $350 per square foot. 150 Cedar Point Cir is a home located in Crisp County with nearby schools including Crisp County Elementary School, Crisp County Primary School, and Crisp County Middle School.
Ownership History
Date
Name
Owned For
Owner Type
Purchase Details
Closed on
Apr 10, 2008
Sold by
Ustunler Patricia Dianne
Bought by
Dale Plug As Exchange Accomoda
Current Estimated Value
Purchase Details
Closed on
Oct 28, 2004
Sold by
Merritt Benjamin and Merritt Dianne
Bought by
Merritt Patricia Dianne
Purchase Details
Closed on
Dec 1, 1997
Sold by
Haralson Donnie R
Bought by
Merritt Benjamin
Purchase Details
Closed on
Oct 29, 1996
Sold by
Harris Curtis and Harris Haide
Bought by
Haralson Donnie R
Purchase Details
Closed on
Sep 21, 1995
Sold by
Brannen Clint B
Bought by
Haralson Donnie R
Purchase Details
Closed on
Sep 16, 1995
Sold by
Prince Ryan F
Bought by
Brannen Clint B
Purchase Details
Closed on
Nov 19, 1992
Sold by
Brannon Motor Co
Bought by
Prince Ryan F
Create a Home Valuation Report for This Property
The Home Valuation Report is an in-depth analysis detailing your home's value as well as a comparison with similar homes in the area
Home Values in the Area
Average Home Value in this Area
Purchase History
| Date | Buyer | Sale Price | Title Company |
|---|---|---|---|
| Dale Plug As Exchange Accomoda | $560,000 | -- | |
| Ustunler Patricia Dianne | -- | -- | |
| Merritt Patricia Dianne | -- | -- | |
| Merritt Benjamin | $259,000 | -- | |
| Haralson Donnie R | -- | -- | |
| Haralson Donnie R | $300,000 | -- | |
| Brannen Clint B | $188,300 | -- | |
| Prince Ryan F | $172,000 | -- |
Source: Public Records
Tax History Compared to Growth
Tax History
| Year | Tax Paid | Tax Assessment Tax Assessment Total Assessment is a certain percentage of the fair market value that is determined by local assessors to be the total taxable value of land and additions on the property. | Land | Improvement |
|---|---|---|---|---|
| 2024 | $9,466 | $349,602 | $111,814 | $237,788 |
| 2023 | $8,262 | $294,181 | $111,814 | $182,367 |
| 2022 | $7,999 | $284,823 | $111,814 | $173,009 |
| 2021 | $7,640 | $257,660 | $111,814 | $145,846 |
| 2020 | $7,652 | $257,660 | $111,814 | $145,846 |
| 2019 | $7,603 | $257,660 | $111,814 | $145,846 |
| 2018 | $8,072 | $263,595 | $137,639 | $125,956 |
| 2017 | $8,106 | $263,595 | $137,639 | $125,956 |
| 2016 | $8,095 | $263,595 | $137,639 | $125,956 |
| 2015 | -- | $263,595 | $137,639 | $125,956 |
| 2014 | -- | $263,595 | $137,639 | $125,956 |
| 2013 | -- | $263,594 | $137,639 | $125,955 |
Source: Public Records
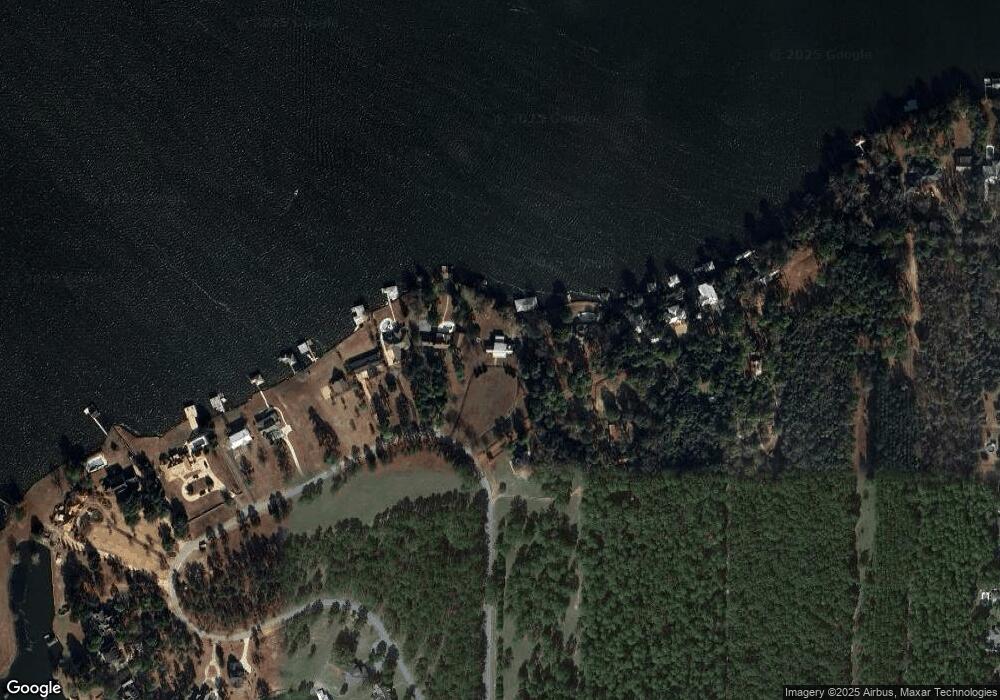
Map
Nearby Homes
- 228 Cedar Point Cir
- 475 N Cedar Creek Rd
- 141 Landing Rd
- 153 Landing Rd
- 984 Scenic Route
- 251 N Cedar Creek Rd
- 850 Scenic Route
- 0 Lot #3 & Part Lot#4 Unit 59461
- 103 Cedar Slough Ct
- 687 Flintside Dr
- 119 Wolfs Thick Rd
- 631 Flintside Dr
- Lot 1, 2 Scenic Route
- 580 Scenic Route
- Lot 3,4 Scenic Route
- 111 Cedar Creek Rd S
- 629 Cork Ferry Rd
- 115 Ellis Ct
- 0 Coney Rd S
- 600 Scenic Route
- 154 Cedar Point Cr
- 154 Cedar Point Cir
- 109 Harbor Ln
- 146 Cedar Point Cir
- 156 Cedar Point Cir
- 142 Cedar Point Cir
- 142 Cedar Point Cr
- 158 Cedar Point Cir
- 396 S Cedar Creek Rd
- 162 Cedar Point Cir
- 0 S Cedar Point Cir
- 168 Cedar Point Cir
- 394 S Cedar Creek Rd
- 174 Cedar Point Cir
- 399 S Cedar Creek Rd
- 178 Cedar Point Cir
- lot 21 Cedar Point Cir
- 186 Cedar Point Cir
- 240 Cedar Point Cir
- 246 Cedar Point Cir