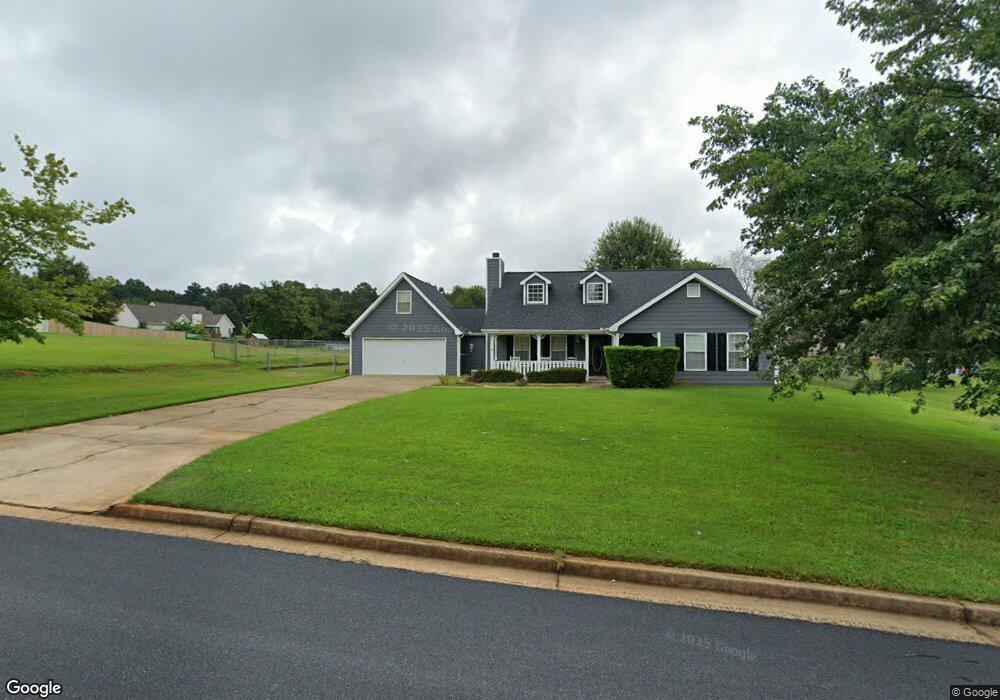
150 Doves Nest Covington, GA 30016
Estimated Value: $254,000 - $276,000
--
Bed
2
Baths
1,650
Sq Ft
$159/Sq Ft
Est. Value
About This Home
This home is located at 150 Doves Nest, Covington, GA 30016 and is currently estimated at $261,677, approximately $158 per square foot. 150 Doves Nest is a home located in Newton County with nearby schools including South Salem Elementary School, Liberty Middle School, and Alcovy High School.
Ownership History
Date
Name
Owned For
Owner Type
Purchase Details
Closed on
Aug 11, 2009
Sold by
Hud-Housing Of Urban Dev
Bought by
Hawkins Thomas L and Hawkins Doris R
Current Estimated Value
Purchase Details
Closed on
Oct 7, 2008
Sold by
Nb Holdings Corp
Bought by
Hud-Housing Of Urban Dev
Purchase Details
Closed on
Aug 27, 2003
Sold by
Garrigus Andrew V
Bought by
Baker Sheevonice
Home Financials for this Owner
Home Financials are based on the most recent Mortgage that was taken out on this home.
Original Mortgage
$113,050
Interest Rate
6.13%
Mortgage Type
FHA
Purchase Details
Closed on
May 29, 1998
Sold by
Doster Builders & Development Inc
Bought by
Garrigus Andrew
Home Financials for this Owner
Home Financials are based on the most recent Mortgage that was taken out on this home.
Original Mortgage
$92,330
Interest Rate
7.11%
Mortgage Type
New Conventional
Create a Home Valuation Report for This Property
The Home Valuation Report is an in-depth analysis detailing your home's value as well as a comparison with similar homes in the area
Home Values in the Area
Average Home Value in this Area
Purchase History
| Date | Buyer | Sale Price | Title Company |
|---|---|---|---|
| Hawkins Thomas L | -- | -- | |
| Hud-Housing Of Urban Dev | -- | -- | |
| Nb Holdings Corp | $116,243 | -- | |
| Baker Sheevonice | $114,000 | -- | |
| Garrigus Andrew | $91,500 | -- |
Source: Public Records
Mortgage History
| Date | Status | Borrower | Loan Amount |
|---|---|---|---|
| Previous Owner | Baker Sheevonice | $113,050 | |
| Previous Owner | Garrigus Andrew | $92,330 |
Source: Public Records
Tax History Compared to Growth
Tax History
| Year | Tax Paid | Tax Assessment Tax Assessment Total Assessment is a certain percentage of the fair market value that is determined by local assessors to be the total taxable value of land and additions on the property. | Land | Improvement |
|---|---|---|---|---|
| 2024 | $1,611 | $104,120 | $15,200 | $88,920 |
| 2023 | $2,133 | $106,640 | $8,800 | $97,840 |
| 2022 | $2,695 | $88,880 | $8,800 | $80,080 |
| 2021 | $1,138 | $65,760 | $8,800 | $56,960 |
| 2020 | $1,010 | $58,480 | $7,200 | $51,280 |
| 2019 | $771 | $51,040 | $7,200 | $43,840 |
| 2018 | $375 | $50,320 | $7,200 | $43,120 |
| 2017 | $438 | $41,200 | $5,600 | $35,600 |
| 2016 | $52 | $28,920 | $3,800 | $25,120 |
| 2015 | $48 | $26,160 | $3,200 | $22,960 |
| 2014 | $47 | $26,160 | $0 | $0 |
Source: Public Records
Map
Nearby Homes
- 115 Branchwood Dr
- 255 Countryside Ln
- 472 Oak Hill Rd
- 205 Woodcrest Dr
- 135 Woodcrest Dr
- 70 Countryside Ln
- 25 Woodcrest Dr
- 145 Whispering Pine Dr
- 265 Lazy Hollow Ln
- 40 Belmont Cir Unit 2
- 75 Oak Hill Dr
- 30 Oak Wood Ln
- 70 Cowan Ridge
- 40 Lakeside Trail
- 230 Belmont Trail
- 800 Mills Dr
- 245 Belmont Trail
- 145 Mill Chase
- 15 Covey Ln
- 160 Doves Nest Unit 6
- 25 Covey Ln Unit 6
- 35 Covey Ln Unit 6
- 400 Branchwood Dr Unit 5
- 145 Doves Nest
- 155 Doves Nest Unit 6
- 10 Covey Ln Unit 6
- 410 Branchwood Dr
- 135 Doves Nest
- 165 Doves Nest
- 420 Branchwood Dr
- 45 Covey Ln Unit 6
- 45 Covey Ln
- 20 Covey Ln Unit 6
- 370 Branchwood Dr Unit 5
- 110 Doves Nest Unit 6
- 40 Covey Ln
- 125 Doves Nest Unit 6
- 30 Covey Ln Unit 6