150 E Murray Rd Grapeview, WA 98546
Estimated Value: $815,000 - $960,000
2
Beds
1
Bath
576
Sq Ft
$1,558/Sq Ft
Est. Value
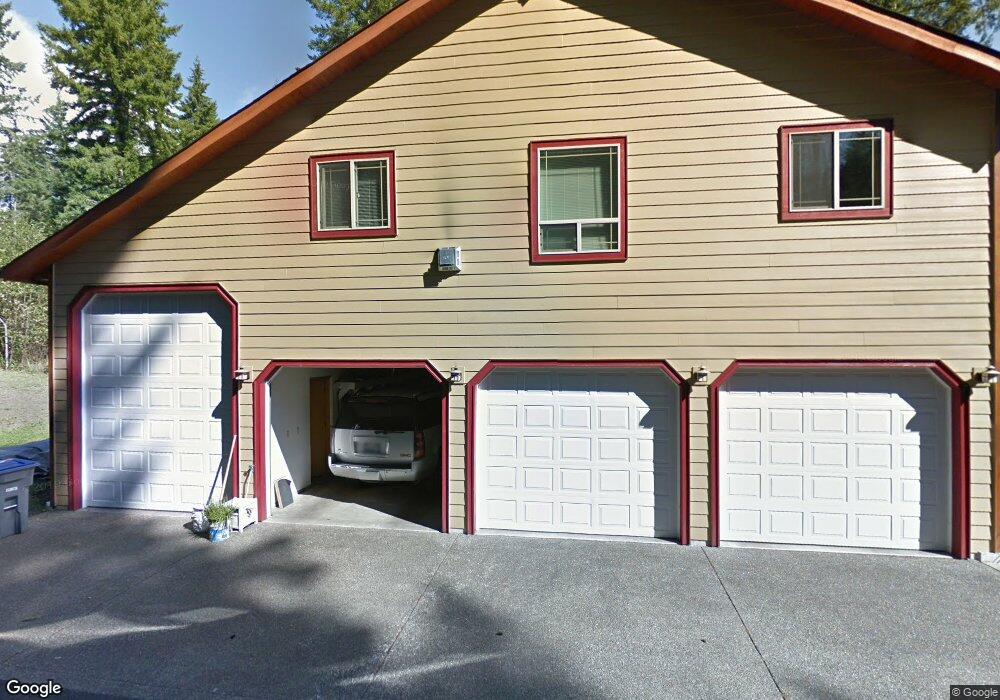
About This Home
This home is located at 150 E Murray Rd, Grapeview, WA 98546 and is currently estimated at $897,257, approximately $1,557 per square foot. 150 E Murray Rd is a home located in Mason County with nearby schools including Grapeview Elementary/Middle School.
Ownership History
Date
Name
Owned For
Owner Type
Purchase Details
Closed on
Dec 12, 2023
Sold by
Bayly Kelly G
Bought by
Slade John M and Singleton-Slade Carol
Current Estimated Value
Purchase Details
Closed on
Apr 20, 2021
Sold by
Bayly Kelly G and Estate Of James Bayly
Bought by
Bayly Kelly G
Purchase Details
Closed on
Jun 1, 2017
Sold by
Fritz Donavan J and Fritz Vicky S
Bought by
Bayly James
Home Financials for this Owner
Home Financials are based on the most recent Mortgage that was taken out on this home.
Original Mortgage
$240,000
Interest Rate
3.97%
Mortgage Type
Purchase Money Mortgage
Purchase Details
Closed on
Nov 2, 2011
Sold by
Fritz Donavan J and Fritz Vicky S
Bought by
Fritz Donavan J and Fritz Vicki S
Create a Home Valuation Report for This Property
The Home Valuation Report is an in-depth analysis detailing your home's value as well as a comparison with similar homes in the area
Purchase History
| Date | Buyer | Sale Price | Title Company |
|---|---|---|---|
| Slade John M | $850,000 | Aegis Land Title | |
| Bayly Kelly G | -- | None Available | |
| Bayly Kelly G | -- | None Available | |
| Bayly James | $640,000 | Land Title | |
| Fritz Donavan J | -- | None Available |
Source: Public Records
Mortgage History
| Date | Status | Borrower | Loan Amount |
|---|---|---|---|
| Previous Owner | Bayly James | $240,000 |
Source: Public Records
Tax History
| Year | Tax Paid | Tax Assessment Tax Assessment Total Assessment is a certain percentage of the fair market value that is determined by local assessors to be the total taxable value of land and additions on the property. | Land | Improvement |
|---|---|---|---|---|
| 2025 | $6,462 | $853,190 | $109,730 | $743,460 |
| 2023 | $6,462 | $950,375 | $127,210 | $823,165 |
| 2022 | $7,222 | $821,840 | $123,510 | $698,330 |
| 2021 | $5,654 | $821,840 | $123,510 | $698,330 |
| 2020 | $5,526 | $639,515 | $144,145 | $495,370 |
| 2018 | $5,217 | $479,645 | $128,700 | $350,945 |
| 2017 | $4,831 | $479,525 | $128,580 | $350,945 |
| 2016 | $4,792 | $472,090 | $100,130 | $371,960 |
| 2015 | $5,078 | $467,310 | $97,000 | $370,310 |
| 2014 | -- | $476,030 | $99,085 | $376,945 |
| 2013 | -- | $467,900 | $93,870 | $374,030 |
Source: Public Records
Map
Nearby Homes
- 310 E Rauschert Rd
- 0 E Murray Rd N Unit NWM2467437
- 148 E Fox Run Ln
- 101 E Pirates Place
- 758 E Promontory Rd
- 432 E Pointes Dr E
- 625 E Pointes Dr W
- 741 E Promontory Rd
- 731 E Promontory Rd
- 664 E Portage Rd
- 713 E Pointes Dr W
- 301 E Pointes Dr E
- 900 E Wilson Way
- 900 930 E Wilson Way
- 930 E Wilson Way
- 670 E Wilson Way
- 5440 E Grapeview Loop Rd
- 90 E Treasure Island Dr
- 1236 E Island View Rd
- 80 E Sea Breeze Ln
- 150 E Murray Rd S
- 200 E Murray Rd S
- 2500 E Grapeview Loop Rd
- 232 E Murray Rd
- 2601 E Grapeview Loop Rd
- 2492 E Grapeview Loop Rd
- 2490 E Grapeview Loop Rd
- 2450 E Grapeview Loop Rd
- 230 E Murray Rd S
- 2750 E Grapeview Lp Rd E
- 101 E Murray Rd N
- 2086 E Grapeview Loop Rd
- 51 E Cormorant Place
- 2280 E Grapeview Loop Rd
- 61 E Cormorant Place
- 71 E Cormorant Place
- 2260 E Grapeview Loop Rd
- 2481 E Grapeview Loop Rd
- 2252 E Grapeview Loop Rd
- 2300 E Grapeview Loop Rd
Your Personal Tour Guide
Ask me questions while you tour the home.