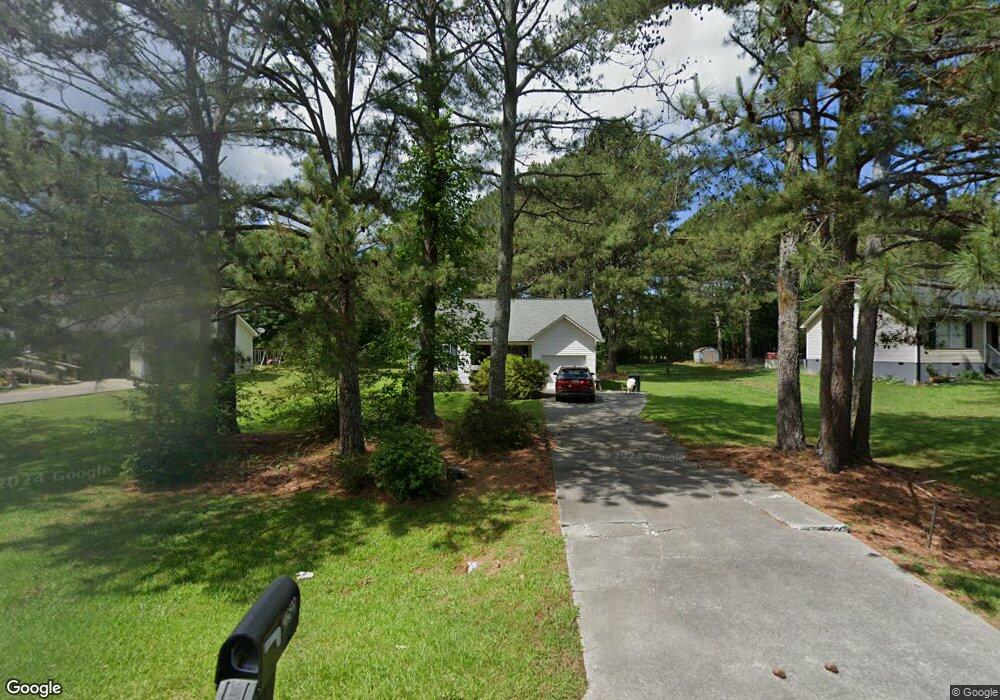
150 Frix Ln SE Calhoun, GA 30701
Estimated Value: $219,891 - $228,000
3
Beds
2
Baths
1,112
Sq Ft
$202/Sq Ft
Est. Value
About This Home
This home is located at 150 Frix Ln SE, Calhoun, GA 30701 and is currently estimated at $224,473, approximately $201 per square foot. 150 Frix Ln SE is a home located in Gordon County with nearby schools including Red Bud Elementary School, Red Bud Middle School, and Sonoraville High School.
Ownership History
Date
Name
Owned For
Owner Type
Purchase Details
Closed on
Jan 24, 2008
Sold by
Beason Leland Dennis
Bought by
Blackstock Stacte K
Current Estimated Value
Home Financials for this Owner
Home Financials are based on the most recent Mortgage that was taken out on this home.
Original Mortgage
$78,350
Outstanding Balance
$61,904
Interest Rate
6.17%
Mortgage Type
New Conventional
Estimated Equity
$162,569
Purchase Details
Closed on
Aug 31, 2004
Sold by
Secretary Of Housing & Urban D
Bought by
Beason Leland Dennis
Purchase Details
Closed on
Apr 6, 2004
Sold by
Clark Joshua I and Clark Tammy C
Bought by
Secretary Of Housing & Urban Development
Purchase Details
Closed on
Jun 4, 1999
Bought by
Clark Joshua I and Clark Tammy C
Purchase Details
Closed on
Aug 30, 1996
Bought by
Hitchock James L and Anna Sue
Create a Home Valuation Report for This Property
The Home Valuation Report is an in-depth analysis detailing your home's value as well as a comparison with similar homes in the area
Home Values in the Area
Average Home Value in this Area
Purchase History
| Date | Buyer | Sale Price | Title Company |
|---|---|---|---|
| Blackstock Stacte K | $98,350 | -- | |
| Beason Leland Dennis | -- | -- | |
| Secretary Of Housing & Urban Development | -- | -- | |
| Washington Mutual Bank Fa | -- | -- | |
| Clark Joshua I | $74,000 | -- | |
| Hitchock James L | $61,200 | -- |
Source: Public Records
Mortgage History
| Date | Status | Borrower | Loan Amount |
|---|---|---|---|
| Open | Blackstock Stacte K | $78,350 | |
| Closed | Blackstock Stacte K | $20,000 |
Source: Public Records
Tax History Compared to Growth
Tax History
| Year | Tax Paid | Tax Assessment Tax Assessment Total Assessment is a certain percentage of the fair market value that is determined by local assessors to be the total taxable value of land and additions on the property. | Land | Improvement |
|---|---|---|---|---|
| 2024 | $1,489 | $60,600 | $6,440 | $54,160 |
| 2023 | $1,394 | $56,880 | $6,440 | $50,440 |
| 2022 | $1,385 | $53,280 | $6,440 | $46,840 |
| 2021 | $1,174 | $43,920 | $6,440 | $37,480 |
| 2020 | $1,104 | $40,520 | $5,880 | $34,640 |
| 2019 | $1,110 | $40,520 | $5,880 | $34,640 |
| 2018 | $917 | $33,840 | $5,040 | $28,800 |
| 2017 | $896 | $32,224 | $5,040 | $27,184 |
| 2016 | $805 | $29,112 | $4,760 | $24,352 |
| 2015 | $798 | $28,632 | $4,760 | $23,872 |
| 2014 | $645 | $24,151 | $4,200 | $19,951 |
Source: Public Records
Map
Nearby Homes
- 177 Frix Ln SE
- 191 Frix Ln SE
- 0 Buck Blvd SE Unit 7362017
- 0 Buck Blvd SE Unit 10275210
- 0 Libby Ln SE Unit 10275212
- 0 Libby Ln SE Unit 7362041
- 4134 Dews Pond Rd SE
- 192 Cardinal Blvd SE
- 194 Cardinal Blvd SE
- 408 Peachtree Ln SE
- 0 Covington Bridge Rd SE Unit 10558075
- 0 Covington Bridge Rd SE Unit 7610123
- 702 Cash Rd SE
- 137 Hunters Trail SE
- 00002 Lovebridge Rd SE
- lot 4 Lovebridge Rd SE
- 127 Alex Ct
- 0 Hunts Gin Rd L2
- 187 Willow Haven St SE
- 153 Oakland Dr SE
- 160 Frix Ln SE
- 140 Frix Ln SE
- 130 Frix Ln SE
- 170 Frix Ln SE
- 153 Frix Ln SE
- 120 Frix Ln SE
- 180 Frix Ln SE
- 135 Frix Ln SE
- 163 Frix Ln SE
- 151 Prater Dr SE
- 141 Prater Dr SE
- 161 Prater Dr SE
- 171 Prater Dr SE
- 131 Prater Dr SE
- 123 Frix Ln SE
- 110 Frix Ln SE
- 190 Frix Ln SE
- 181 Prater Dr SE
- 121 Prater Dr SE
- 4308 Dews Pond Rd SE