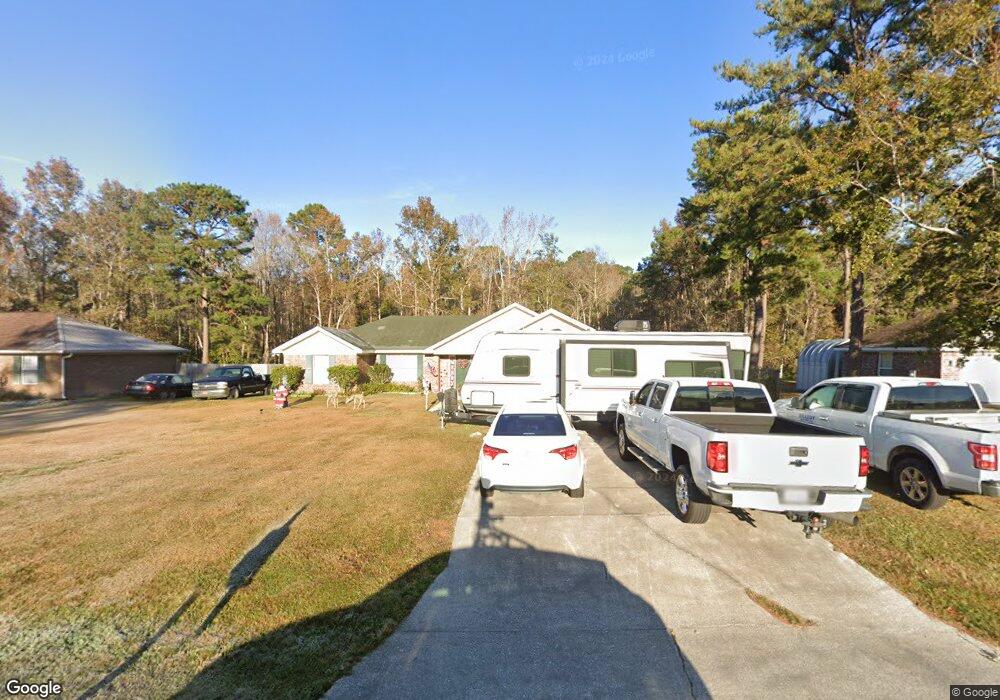
150 Huger St Rincon, GA 31326
Estimated Value: $288,866 - $331,000
Studio
1
Bath
1,556
Sq Ft
$201/Sq Ft
Est. Value
About This Home
This home is located at 150 Huger St, Rincon, GA 31326 and is currently estimated at $312,967, approximately $201 per square foot. 150 Huger St is a home located in Effingham County with nearby schools including South Effingham Elementary School, South Effingham Middle School, and South Effingham High School.
Ownership History
Date
Name
Owned For
Owner Type
Purchase Details
Closed on
May 12, 2006
Sold by
Lanier Renaissance Inc
Bought by
Brown Lloyd Bernard
Current Estimated Value
Home Financials for this Owner
Home Financials are based on the most recent Mortgage that was taken out on this home.
Original Mortgage
$152,910
Outstanding Balance
$99,744
Interest Rate
8.93%
Mortgage Type
New Conventional
Estimated Equity
$213,223
Purchase Details
Closed on
Feb 7, 2006
Sold by
Lanier Marion T
Bought by
Lanier Renaissance Inc
Create a Home Valuation Report for This Property
The Home Valuation Report is an in-depth analysis detailing your home's value as well as a comparison with similar homes in the area
Home Values in the Area
Average Home Value in this Area
Purchase History
| Date | Buyer | Sale Price | Title Company |
|---|---|---|---|
| Brown Lloyd Bernard | $169,900 | -- | |
| Lanier Renaissance Inc | -- | -- | |
| Lanier Marion T | $140,128 | -- |
Source: Public Records
Mortgage History
| Date | Status | Borrower | Loan Amount |
|---|---|---|---|
| Open | Brown Lloyd Bernard | $152,910 |
Source: Public Records
Tax History
| Year | Tax Paid | Tax Assessment Tax Assessment Total Assessment is a certain percentage of the fair market value that is determined by local assessors to be the total taxable value of land and additions on the property. | Land | Improvement |
|---|---|---|---|---|
| 2025 | $2,624 | $119,723 | $22,800 | $96,923 |
| 2024 | $2,624 | $120,490 | $22,800 | $97,690 |
| 2023 | $2,355 | $101,704 | $18,800 | $82,904 |
| 2022 | $2,278 | $78,454 | $14,000 | $64,454 |
| 2021 | $2,220 | $74,047 | $14,000 | $60,047 |
| 2020 | $2,197 | $69,763 | $14,000 | $55,763 |
| 2019 | $2,123 | $65,042 | $14,000 | $51,042 |
| 2018 | $2,101 | $63,489 | $14,000 | $49,489 |
| 2017 | $2,051 | $61,315 | $14,000 | $47,315 |
| 2016 | $2,152 | $67,918 | $16,800 | $51,118 |
| 2015 | -- | $63,118 | $12,000 | $51,118 |
| 2014 | -- | $59,918 | $8,800 | $51,118 |
| 2013 | -- | $55,958 | $4,840 | $51,118 |
Source: Public Records
Map
Nearby Homes
Your Personal Tour Guide
Ask me questions while you tour the home.