150 Kensington Pond Ct Unit 1 Roswell, GA 30075
Estimated Value: $755,000 - $931,000
4
Beds
4
Baths
3,219
Sq Ft
$262/Sq Ft
Est. Value
About This Home
This home is located at 150 Kensington Pond Ct Unit 1, Roswell, GA 30075 and is currently estimated at $843,699, approximately $262 per square foot. 150 Kensington Pond Ct Unit 1 is a home located in Fulton County with nearby schools including Sweet Apple Elementary School, Elkins Pointe Middle School, and Fulton Academy of Science and Technology.
Ownership History
Date
Name
Owned For
Owner Type
Purchase Details
Closed on
Apr 26, 2001
Sold by
Whitaker Whitaker J and Whitaker Jacqueline G
Bought by
Tilles Murray and Tilles Alana T
Current Estimated Value
Home Financials for this Owner
Home Financials are based on the most recent Mortgage that was taken out on this home.
Original Mortgage
$268,000
Outstanding Balance
$99,107
Interest Rate
6.9%
Mortgage Type
New Conventional
Estimated Equity
$744,592
Purchase Details
Closed on
Aug 28, 1996
Sold by
Tate Blaire S Janet B
Bought by
Whitaker J Greg Jacqueline
Purchase Details
Closed on
Feb 17, 1993
Sold by
Wieland John Homes Inc
Bought by
Tate Blaine S Janet B
Home Financials for this Owner
Home Financials are based on the most recent Mortgage that was taken out on this home.
Original Mortgage
$100,000
Interest Rate
7.8%
Create a Home Valuation Report for This Property
The Home Valuation Report is an in-depth analysis detailing your home's value as well as a comparison with similar homes in the area
Home Values in the Area
Average Home Value in this Area
Purchase History
| Date | Buyer | Sale Price | Title Company |
|---|---|---|---|
| Tilles Murray | $335,000 | -- | |
| Whitaker J Greg Jacqueline | $276,500 | -- | |
| Tate Blaine S Janet B | $347,400 | -- |
Source: Public Records
Mortgage History
| Date | Status | Borrower | Loan Amount |
|---|---|---|---|
| Open | Tilles Murray | $268,000 | |
| Previous Owner | Tate Blaine S Janet B | $100,000 | |
| Closed | Whitaker J Greg Jacqueline | $0 |
Source: Public Records
Tax History Compared to Growth
Tax History
| Year | Tax Paid | Tax Assessment Tax Assessment Total Assessment is a certain percentage of the fair market value that is determined by local assessors to be the total taxable value of land and additions on the property. | Land | Improvement |
|---|---|---|---|---|
| 2025 | $1,025 | $270,520 | $68,160 | $202,360 |
| 2023 | $5,007 | $177,400 | $35,120 | $142,280 |
| 2022 | $4,342 | $177,400 | $35,120 | $142,280 |
| 2021 | $4,787 | $165,120 | $34,080 | $131,040 |
| 2020 | $4,855 | $163,160 | $33,680 | $129,480 |
| 2019 | $783 | $177,720 | $35,640 | $142,080 |
| 2018 | $4,466 | $182,680 | $62,160 | $120,520 |
| 2017 | $3,991 | $150,560 | $37,440 | $113,120 |
| 2016 | $3,970 | $150,560 | $37,440 | $113,120 |
| 2015 | $4,806 | $150,560 | $37,440 | $113,120 |
| 2014 | $3,517 | $127,480 | $32,600 | $94,880 |
Source: Public Records
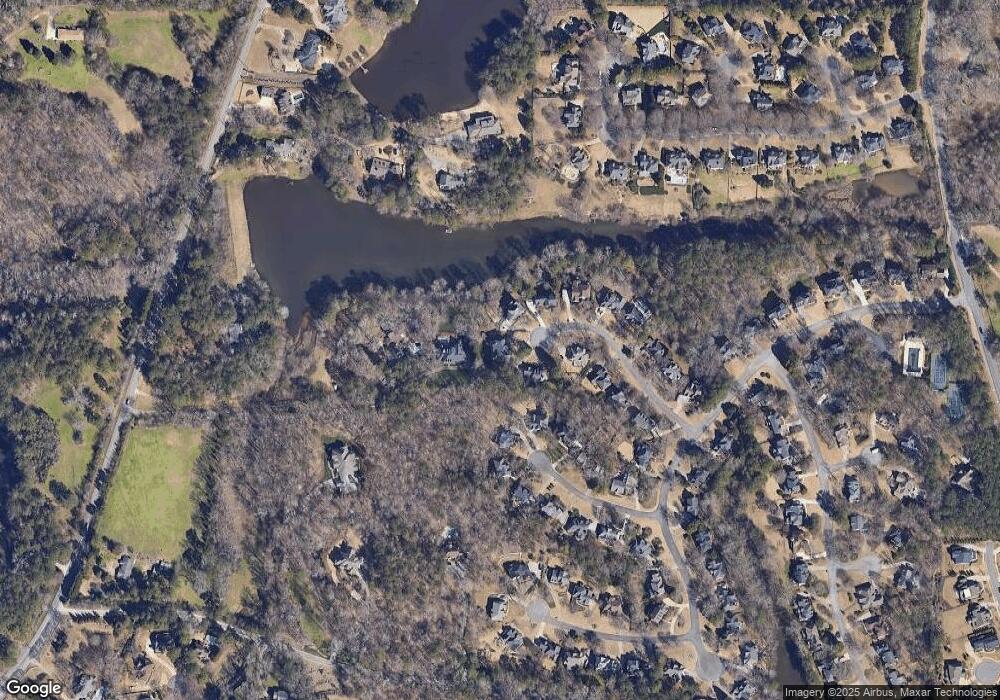
Map
Nearby Homes
- 515 Kent Rd
- 105 Kensington Pond Ct
- 12867 Etris Walk
- 125 Fortuna Ct
- 161 Brook Ln
- 680 Brookfield Pkwy Unit 1
- 130 Nova Ln
- 12620 Old Surrey Place
- 870 Hickory Oak Hollow
- 130 Cedarwood Ln
- 160 Cedarwood Ln
- 120 Cedarwood Ln
- 140 Cedarwood Ln
- 406 Sweet Apple Cir
- 127 Quinn Way
- 113 Quinn Way
- 12655 New Providence Rd
- 180 Cedarwood Ln
- 137 Quinn Way
- 150 Cedarwood Ln
- 140 Kensington Pond Ct
- 160 Kensington Pond Ct
- 12291 King Rd
- 165 Kensington Pond Ct
- 735 Devon Hill Ct Unit 2
- 130 Kensington Pond Ct
- 12301 King Rd
- 155 Kensington Pond Ct
- 0 Kensington Pond Ct Unit 7518008
- 0 Kensington Pond Ct Unit 8514820
- 0 Kensington Pond Ct Unit 8383995
- 0 Kensington Pond Ct Unit 8136471
- 0 Kensington Pond Ct Unit 7261988
- 0 Kensington Pond Ct
- 725 Devon Hill Ct Unit 2
- 7401 Devon Hill Ct
- 120 Kensington Pond Ct Unit 1
- 750 Devon Hill Ct Unit 2
- 110 Kensington Pond Ct
- 145 Kensington Pond Ct