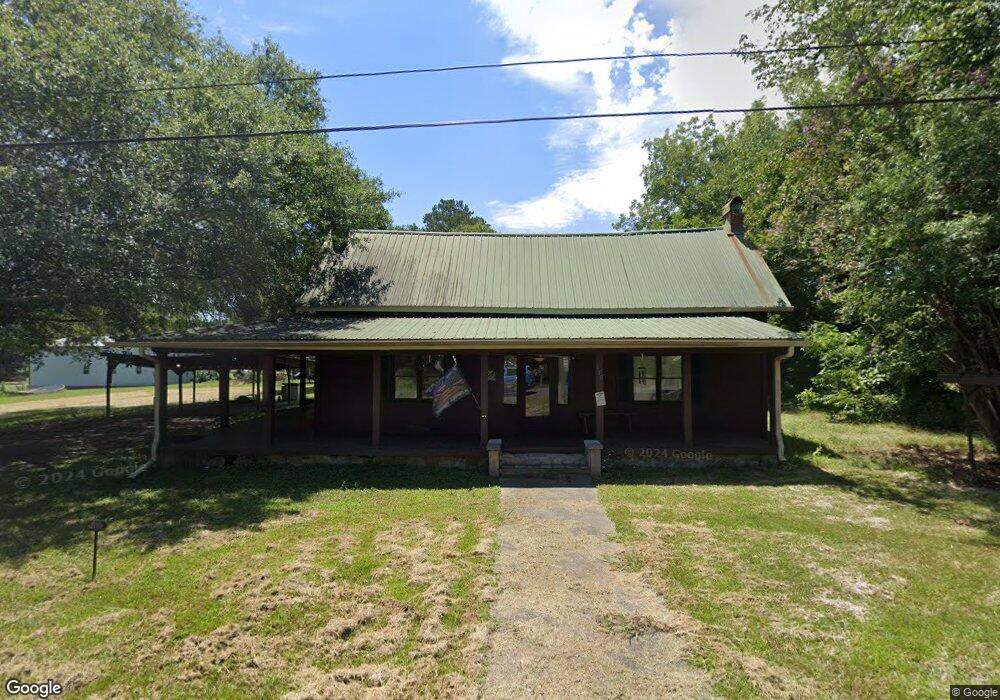
150 Mcleod St Lyerly, GA 30730
Estimated Value: $168,000 - $198,000
4
Beds
1
Bath
2,058
Sq Ft
$88/Sq Ft
Est. Value
About This Home
This home is located at 150 Mcleod St, Lyerly, GA 30730 and is currently estimated at $180,122, approximately $87 per square foot. 150 Mcleod St is a home located in Chattooga County with nearby schools including Chattooga High School.
Ownership History
Date
Name
Owned For
Owner Type
Purchase Details
Closed on
Jan 21, 2011
Sold by
White Steve
Bought by
Lanham Nell A
Current Estimated Value
Home Financials for this Owner
Home Financials are based on the most recent Mortgage that was taken out on this home.
Original Mortgage
$91,751
Outstanding Balance
$62,583
Interest Rate
4.79%
Mortgage Type
New Conventional
Estimated Equity
$117,539
Purchase Details
Closed on
Jul 11, 2008
Sold by
Not Provided
Bought by
Lanham Nell A
Create a Home Valuation Report for This Property
The Home Valuation Report is an in-depth analysis detailing your home's value as well as a comparison with similar homes in the area
Home Values in the Area
Average Home Value in this Area
Purchase History
| Date | Buyer | Sale Price | Title Company |
|---|---|---|---|
| Lanham Nell A | $87,000 | -- | |
| Lanham Nell A | -- | -- |
Source: Public Records
Mortgage History
| Date | Status | Borrower | Loan Amount |
|---|---|---|---|
| Open | Lanham Nell A | $91,751 |
Source: Public Records
Tax History Compared to Growth
Tax History
| Year | Tax Paid | Tax Assessment Tax Assessment Total Assessment is a certain percentage of the fair market value that is determined by local assessors to be the total taxable value of land and additions on the property. | Land | Improvement |
|---|---|---|---|---|
| 2024 | $1,977 | $67,636 | $1,480 | $66,156 |
| 2023 | $2,138 | $59,540 | $1,480 | $58,060 |
| 2022 | $869 | $39,163 | $849 | $38,314 |
| 2021 | $864 | $28,075 | $849 | $27,226 |
| 2020 | $899 | $30,075 | $849 | $29,226 |
| 2019 | $913 | $30,024 | $798 | $29,226 |
| 2018 | $855 | $29,367 | $798 | $28,569 |
| 2017 | $881 | $29,367 | $798 | $28,569 |
| 2016 | $791 | $29,367 | $798 | $28,569 |
| 2015 | -- | $29,669 | $798 | $28,871 |
| 2014 | -- | $29,669 | $798 | $28,871 |
| 2013 | -- | $30,327 | $1,456 | $28,871 |
Source: Public Records
Map
Nearby Homes
- 0 Gaylor Rd Unit 22865068
- 0 Gaylor Rd Unit 10497505
- 0 Gaylor Rd Unit 10497539
- 0 Georgia 100
- 557 Acres On Taliaferro Springs Rd
- 441 Lyerly Dam Rd
- 1503 Taliaferro Springs Rd
- 386 Oak Grove Rd
- 0 Tract 14 Unit 10476683
- #46 Owens Dairy Rd
- 0 Echols Rd
- 0 Back Valley Rd Unit 25316915
- 0 Back Valley Rd Unit 25591197
- 0 Back Valley Rd Unit 25602608
- 0 Back Valley Rd Unit 25369328
- 0 Back Valley Rd Unit 25606694
- 0 Back Valley Rd Unit 25602078
- 110 Dove Cir
- 1516 Fish Hatchery Rd
- 8690 Silver Hill Rd