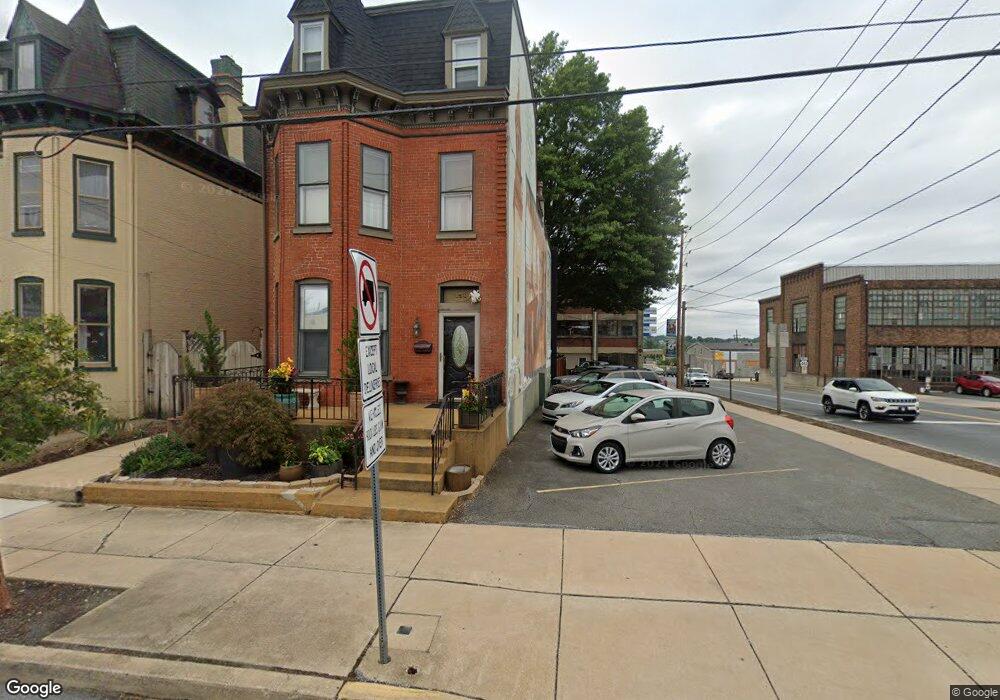
150 N 3rd St Columbia, PA 17512
Estimated Value: $248,000 - $287,915
5
Beds
2
Baths
2,592
Sq Ft
$103/Sq Ft
Est. Value
About This Home
This home is located at 150 N 3rd St, Columbia, PA 17512 and is currently estimated at $267,479, approximately $103 per square foot. 150 N 3rd St is a home located in Lancaster County with nearby schools including Columbia Middle School, Columbia High School, and Our Lady of the Angels School.
Ownership History
Date
Name
Owned For
Owner Type
Purchase Details
Closed on
Dec 8, 2005
Sold by
Beckley James W and Beckley Elaine M
Bought by
Beckley James W and Beckley Elaine M
Current Estimated Value
Home Financials for this Owner
Home Financials are based on the most recent Mortgage that was taken out on this home.
Original Mortgage
$20,000
Interest Rate
6.34%
Mortgage Type
Stand Alone Second
Purchase Details
Closed on
Oct 11, 2000
Sold by
Citifinancial Services Inc
Bought by
Rice Elaine M and Beckley James W
Home Financials for this Owner
Home Financials are based on the most recent Mortgage that was taken out on this home.
Original Mortgage
$42,650
Interest Rate
7.89%
Purchase Details
Closed on
Mar 22, 2000
Sold by
Wood Jeanie M and Wood Richard G
Bought by
Citifinancial Services Inc and Commercial Credit Plan Consumer Discount
Create a Home Valuation Report for This Property
The Home Valuation Report is an in-depth analysis detailing your home's value as well as a comparison with similar homes in the area
Home Values in the Area
Average Home Value in this Area
Purchase History
| Date | Buyer | Sale Price | Title Company |
|---|---|---|---|
| Beckley James W | -- | None Available | |
| Rice Elaine M | $44,900 | Fidelity National Title Ins | |
| Citifinancial Services Inc | $20,000 | -- |
Source: Public Records
Mortgage History
| Date | Status | Borrower | Loan Amount |
|---|---|---|---|
| Closed | Beckley James W | $20,000 | |
| Closed | Rice Elaine M | $42,650 |
Source: Public Records
Tax History Compared to Growth
Tax History
| Year | Tax Paid | Tax Assessment Tax Assessment Total Assessment is a certain percentage of the fair market value that is determined by local assessors to be the total taxable value of land and additions on the property. | Land | Improvement |
|---|---|---|---|---|
| 2025 | $4,260 | $114,000 | $23,700 | $90,300 |
| 2024 | $4,260 | $114,000 | $23,700 | $90,300 |
| 2023 | $4,260 | $114,000 | $23,700 | $90,300 |
| 2022 | $4,260 | $114,000 | $23,700 | $90,300 |
| 2021 | $4,260 | $114,000 | $23,700 | $90,300 |
| 2020 | $4,260 | $114,000 | $23,700 | $90,300 |
| 2019 | $4,187 | $114,000 | $23,700 | $90,300 |
| 2018 | $4,526 | $114,000 | $23,700 | $90,300 |
| 2017 | $3,561 | $86,700 | $16,800 | $69,900 |
| 2016 | $3,561 | $86,700 | $16,800 | $69,900 |
| 2015 | $1,017 | $86,700 | $16,800 | $69,900 |
| 2014 | $2,144 | $86,700 | $16,800 | $69,900 |
Source: Public Records
Map
Nearby Homes