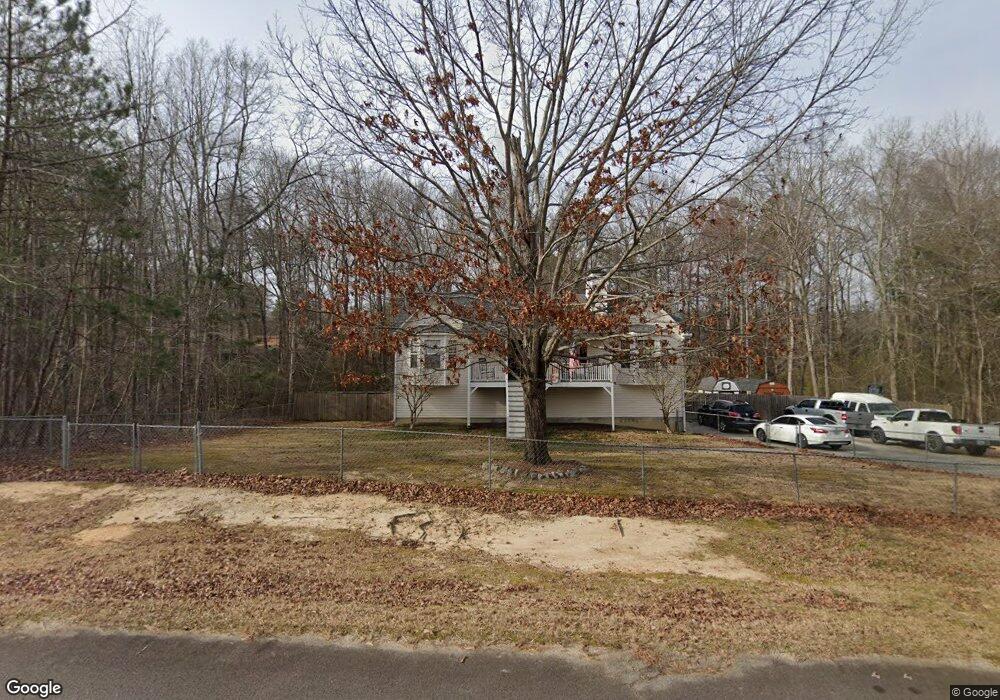
150 N Loblolly Crossing Temple, GA 30179
Estimated Value: $273,485 - $292,000
3
Beds
2
Baths
1,276
Sq Ft
$223/Sq Ft
Est. Value
About This Home
This home is located at 150 N Loblolly Crossing, Temple, GA 30179 and is currently estimated at $284,121, approximately $222 per square foot. 150 N Loblolly Crossing is a home located in Carroll County with nearby schools including Temple Elementary School, Temple Middle School, and Temple High School.
Ownership History
Date
Name
Owned For
Owner Type
Purchase Details
Closed on
Dec 1, 2009
Sold by
Reams Patrick F
Bought by
Whitehead Richard
Current Estimated Value
Purchase Details
Closed on
Jun 24, 2009
Sold by
Fifth Third Mtg Co
Bought by
Reams Patrick
Purchase Details
Closed on
May 6, 2008
Sold by
Sims Marvin D
Bought by
Fifth Third Mtg Co
Purchase Details
Closed on
May 4, 2001
Sold by
Dillon Michael D
Bought by
Sims Marvin D and Sims Tone
Purchase Details
Closed on
Sep 28, 2000
Sold by
Premier Prop
Bought by
Dillon Michael D
Purchase Details
Closed on
Jun 6, 2000
Sold by
H & S Construction C
Bought by
Southern Value Homes
Purchase Details
Closed on
Mar 24, 2000
Sold by
Premier Properties
Bought by
H & S Construction C
Create a Home Valuation Report for This Property
The Home Valuation Report is an in-depth analysis detailing your home's value as well as a comparison with similar homes in the area
Home Values in the Area
Average Home Value in this Area
Purchase History
| Date | Buyer | Sale Price | Title Company |
|---|---|---|---|
| Whitehead Richard | $50,000 | -- | |
| Reams Patrick | $60,000 | -- | |
| Fifth Third Mtg Co | $88,720 | -- | |
| Sims Marvin D | $106,000 | -- | |
| Dillon Michael D | $20,500 | -- | |
| Premier Prop | $16,000 | -- | |
| Southern Value Homes | -- | -- | |
| H & S Construction C | $17,000 | -- |
Source: Public Records
Tax History Compared to Growth
Tax History
| Year | Tax Paid | Tax Assessment Tax Assessment Total Assessment is a certain percentage of the fair market value that is determined by local assessors to be the total taxable value of land and additions on the property. | Land | Improvement |
|---|---|---|---|---|
| 2024 | $2,784 | $123,081 | $8,000 | $115,081 |
| 2023 | $2,784 | $112,654 | $8,000 | $104,654 |
| 2022 | $2,310 | $92,087 | $8,000 | $84,087 |
| 2021 | $1,701 | $66,341 | $8,000 | $58,341 |
| 2020 | $1,523 | $59,328 | $8,000 | $51,328 |
| 2019 | $1,441 | $55,664 | $8,000 | $47,664 |
| 2018 | $1,132 | $43,121 | $4,000 | $39,121 |
| 2017 | $1,136 | $43,121 | $4,000 | $39,121 |
| 2016 | $1,136 | $43,121 | $4,000 | $39,121 |
| 2015 | $1,058 | $37,825 | $8,000 | $29,825 |
| 2014 | $1,062 | $37,825 | $8,000 | $29,825 |
Source: Public Records
Map
Nearby Homes
- 390 Bar J Rd
- 0 Pleasant Oak Dr Unit 10610473
- 0 Pleasant Oak Dr Unit 148244
- 643 Windy Mill Way
- 702 Miller Ct
- 630 Olde Mill Place
- 832 Windy Mill Ct
- 848 Windy Mill Ct
- 705 Mill Creek Dr
- 240 River Oak Ct
- 396 Lakeridge Dr
- 145 Gentle Breeze Ct
- 0 Bar J Rd Unit 10578558
- 0 Bar J Rd Unit 7627694
- 566 Clinton Dr
- 305 Overland Trail
- 212 Stagecoach Pass
- 528 Clinton Dr
- 341 Oak Shade Rd
- 143 N Loblolly Crossing
- 129 N Loblolly Crossing
- 400 Bar J Rd
- 157 N Loblolly Crossing
- 115 N Loblolly Crossing
- 410 Bar J Rd
- 199 N Loblolly Crossing
- 101 N Loblolly Crossing
- 0 Pleasant Oak Dr Unit 7603574
- 25 Pleasant Oak Dr
- 94 N Loblolly Crossing
- 206 N Loblolly Crossing
- 372 Bar J Rd
- 26 N Red Oak Way
- 87 N Loblolly Crossing
- 422 Bar J Rd
- 80 N Loblolly Crossing
- 220 N Loblolly Crossing
- 0 NW North Red Oak Unit 8413364
- 213 N Loblolly Crossing