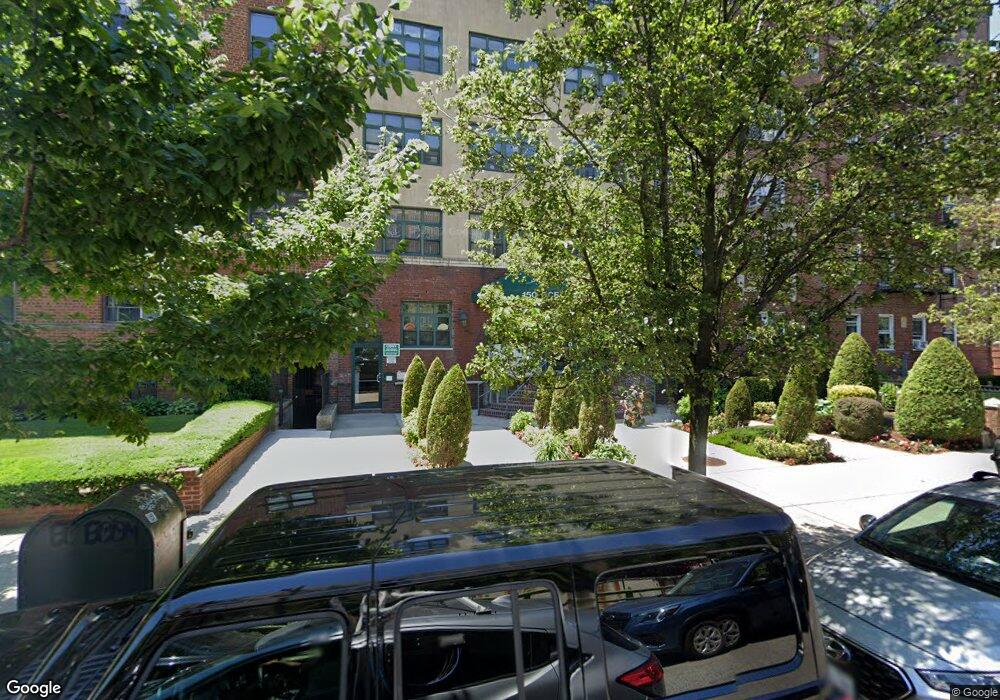
150 Ocean Pkwy Unit 5C Brooklyn, NY 11218
Kensington NeighborhoodEstimated Value: $696,000 - $1,095,000
2
Beds
2
Baths
1,000
Sq Ft
$857/Sq Ft
Est. Value
About This Home
This home is located at 150 Ocean Pkwy Unit 5C, Brooklyn, NY 11218 and is currently estimated at $856,757, approximately $856 per square foot. 150 Ocean Pkwy Unit 5C is a home located in Kings County with nearby schools including P.S. 130 - The Parkside School, Ditmas Junior High school, and Brooklyn Prospect High School.
Ownership History
Date
Name
Owned For
Owner Type
Purchase Details
Closed on
Jul 20, 2016
Sold by
Dong Hai Yi and Dong Sammy
Bought by
Duran Wald Maria F and Wald Karl Alexander
Current Estimated Value
Home Financials for this Owner
Home Financials are based on the most recent Mortgage that was taken out on this home.
Original Mortgage
$417,000
Outstanding Balance
$331,561
Interest Rate
3.54%
Mortgage Type
New Conventional
Estimated Equity
$525,196
Purchase Details
Closed on
Jun 27, 2008
Sold by
Petrossian Karine
Bought by
Dong Hai Yi and Dong Sammy
Home Financials for this Owner
Home Financials are based on the most recent Mortgage that was taken out on this home.
Original Mortgage
$376,500
Interest Rate
6.13%
Mortgage Type
Purchase Money Mortgage
Purchase Details
Closed on
Feb 24, 2003
Sold by
Ocean Parkway Associates 150 Llc
Bought by
Petrossian Karine
Create a Home Valuation Report for This Property
The Home Valuation Report is an in-depth analysis detailing your home's value as well as a comparison with similar homes in the area
Home Values in the Area
Average Home Value in this Area
Purchase History
| Date | Buyer | Sale Price | Title Company |
|---|---|---|---|
| Duran Wald Maria F | $775,000 | -- | |
| Dong Hai Yi | $476,500 | -- | |
| Dong Hai Yi | $476,500 | -- | |
| Petrossian Karine | $282,000 | -- | |
| Petrossian Karine | $282,000 | -- |
Source: Public Records
Mortgage History
| Date | Status | Borrower | Loan Amount |
|---|---|---|---|
| Open | Duran Wald Maria F | $417,000 | |
| Previous Owner | Dong Hai Yi | $376,500 | |
| Closed | Petrossian Karine | $0 |
Source: Public Records
Tax History Compared to Growth
Tax History
| Year | Tax Paid | Tax Assessment Tax Assessment Total Assessment is a certain percentage of the fair market value that is determined by local assessors to be the total taxable value of land and additions on the property. | Land | Improvement |
|---|---|---|---|---|
| 2025 | $7,025 | $60,675 | $2,499 | $58,176 |
| 2024 | $7,025 | $59,555 | $2,499 | $57,056 |
| 2023 | $6,748 | $59,342 | $2,499 | $56,843 |
| 2022 | $6,657 | $57,129 | $2,499 | $54,630 |
| 2021 | $6,013 | $49,021 | $2,499 | $46,522 |
| 2020 | $3,076 | $53,680 | $2,499 | $51,181 |
| 2019 | $6,037 | $53,680 | $2,499 | $51,181 |
| 2018 | $5,627 | $56,311 | $2,499 | $53,812 |
| 2017 | $4,105 | $46,746 | $2,499 | $44,247 |
| 2016 | $3,032 | $42,425 | $2,499 | $39,926 |
| 2015 | $592 | $40,167 | $2,499 | $37,668 |
| 2014 | $592 | $35,578 | $2,499 | $33,079 |
Source: Public Records
Map
Nearby Homes
- 160 Ocean Pkwy Unit 6C
- 135 Ocean Pkwy Unit 11S
- 135 Ocean Pkwy Unit 17H
- 135 Ocean Pkwy Unit 4L
- 135 Ocean Pkwy Unit 10L
- 179 Ocean Pkwy Unit 3C
- 414 Albemarle Rd Unit 1D
- 100 Ocean Pkwy Unit 3G
- 100 Ocean Pkwy Unit 4K
- 207 Ocean Pkwy Unit 3J
- 207 Ocean Pkwy Unit 1J
- 271 Church Ave
- 81 Ocean Pkwy Unit 3J
- 809 Friel Place
- 227 Ocean Pkwy Unit 7 F
- 227 Ocean Pkwy Unit 6 L
- 192 E 8th St Unit 4D
- 222 Albemarle Rd
- 233 Ocean Pkwy Unit 6A
- 235 Ocean Pkwy Unit G
- 150 Ocean Pkwy Unit 6D
- 150 Ocean Pkwy Unit 62
- 150 Ocean Pkwy Unit 6B
- 150 Ocean Pkwy Unit 6A
- 150 Ocean Pkwy Unit 5D
- 150 Ocean Pkwy Unit 5B
- 150 Ocean Pkwy Unit 5A
- 150 Ocean Pkwy Unit 4D
- 150 Ocean Pkwy Unit 4C
- 150 Ocean Pkwy Unit 4B
- 150 Ocean Pkwy Unit 4A
- 150 Ocean Pkwy Unit 3E
- 150 Ocean Pkwy Unit 3D
- 150 Ocean Pkwy Unit 3C
- 150 Ocean Pkwy Unit 3B
- 150 Ocean Pkwy Unit 3A
- 150 Ocean Pkwy Unit 2D
- 150 Ocean Pkwy Unit 2C
- 150 Ocean Pkwy Unit 2B
- 150 Ocean Pkwy Unit 2A