150 Peach Dr Roslyn, NY 11576
Estimated Value: $1,323,000 - $1,947,090
4
Beds
3
Baths
2,798
Sq Ft
$584/Sq Ft
Est. Value
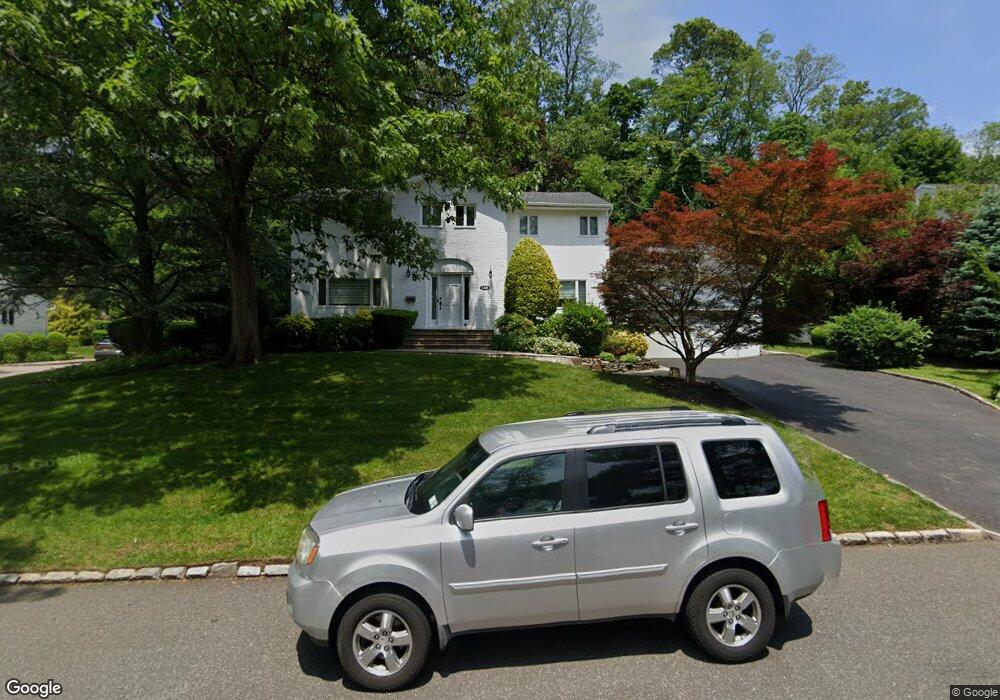
About This Home
This home is located at 150 Peach Dr, Roslyn, NY 11576 and is currently estimated at $1,635,045, approximately $584 per square foot. 150 Peach Dr is a home located in Nassau County with nearby schools including Roslyn Middle School, Roslyn High School, and Henry Viscardi School.
Ownership History
Date
Name
Owned For
Owner Type
Purchase Details
Closed on
Oct 11, 2023
Sold by
Naparty Matthew
Bought by
Rfs Peach Llc
Current Estimated Value
Home Financials for this Owner
Home Financials are based on the most recent Mortgage that was taken out on this home.
Original Mortgage
$865,900
Outstanding Balance
$847,978
Interest Rate
7.09%
Mortgage Type
New Conventional
Estimated Equity
$787,067
Purchase Details
Closed on
Sep 19, 2023
Sold by
Schwager Rachelle
Bought by
Naparty Matthew
Home Financials for this Owner
Home Financials are based on the most recent Mortgage that was taken out on this home.
Original Mortgage
$865,900
Outstanding Balance
$847,978
Interest Rate
7.09%
Mortgage Type
New Conventional
Estimated Equity
$787,067
Purchase Details
Closed on
May 30, 2000
Sold by
Schwager David and Schwager Rachelle
Bought by
Schwager Rachelle
Create a Home Valuation Report for This Property
The Home Valuation Report is an in-depth analysis detailing your home's value as well as a comparison with similar homes in the area
Home Values in the Area
Average Home Value in this Area
Purchase History
| Date | Buyer | Sale Price | Title Company |
|---|---|---|---|
| Rfs Peach Llc | -- | Preferred Abstract Corp | |
| Rfs Peach Llc | -- | Preferred Abstract Corp | |
| Naparty Matthew | $1,237,000 | Preferred Abstract Corp | |
| Naparty Matthew | $1,237,000 | Preferred Abstract Corp | |
| Schwager Rachelle | $10,000 | Jeffrey Schecter | |
| Schwager Rachelle | $10,000 | Jeffrey Schecter |
Source: Public Records
Mortgage History
| Date | Status | Borrower | Loan Amount |
|---|---|---|---|
| Open | Naparty Matthew | $865,900 | |
| Closed | Naparty Matthew | $865,900 |
Source: Public Records
Tax History Compared to Growth
Tax History
| Year | Tax Paid | Tax Assessment Tax Assessment Total Assessment is a certain percentage of the fair market value that is determined by local assessors to be the total taxable value of land and additions on the property. | Land | Improvement |
|---|---|---|---|---|
| 2025 | $25,074 | $1,123 | $451 | $672 |
| 2024 | $4,478 | $1,165 | $468 | $697 |
| 2023 | $19,933 | $1,135 | $456 | $679 |
| 2022 | $19,933 | $1,198 | $481 | $717 |
| 2021 | $19,522 | $1,227 | $493 | $734 |
| 2020 | $18,811 | $1,238 | $1,237 | $1 |
| 2019 | $15,801 | $1,326 | $1,283 | $43 |
| 2018 | $16,117 | $1,415 | $0 | $0 |
| 2017 | $13,709 | $1,503 | $1,225 | $278 |
| 2016 | $17,159 | $1,592 | $1,241 | $351 |
| 2015 | $3,645 | $1,680 | $1,190 | $490 |
| 2014 | $3,645 | $1,680 | $1,190 | $490 |
| 2013 | $3,637 | $1,756 | $1,245 | $511 |
Source: Public Records
Map
Nearby Homes
- 110 Peach Dr
- 75 Mimosa Dr
- 9 Circle Ln
- 317 Main St Unit A
- 330 Chestnut Dr
- 309 Main St Unit D
- 157 E Broadway
- 151 Milburn Ln
- 7 Edwards St Unit 2G
- 90 E Broadway
- 23 Edwards St Unit 1C
- 80 E Broadway
- 3 Edwards St Unit 1G
- 77 Edwards St Unit 2 A
- 81 Edwards St Unit T
- 122 Main St
- 2 Edwards St Unit 3 B
- 94 Main St
- 102 Edwards St Unit 1C
- 108 Edwards St Unit A