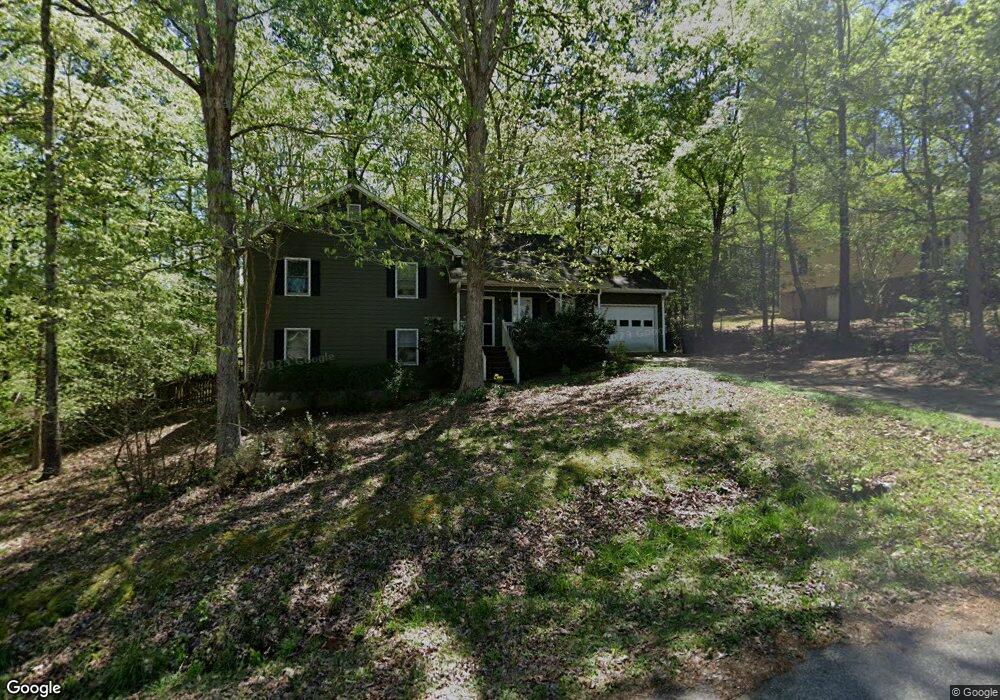
150 Pheasant Run Bogart, GA 30622
Estimated Value: $317,000 - $362,000
4
Beds
3
Baths
1,380
Sq Ft
$244/Sq Ft
Est. Value
About This Home
This home is located at 150 Pheasant Run, Bogart, GA 30622 and is currently estimated at $336,508, approximately $243 per square foot. 150 Pheasant Run is a home located in Clarke County with nearby schools including Cleveland Road Elementary School, Burney-Harris-Lyons Middle School, and Clarke Central High School.
Ownership History
Date
Name
Owned For
Owner Type
Purchase Details
Closed on
Jun 3, 2025
Sold by
Smith Jeremy Colin
Bought by
Smith Jeremy Colin
Current Estimated Value
Purchase Details
Closed on
Dec 30, 2020
Sold by
Smashey Christina L
Bought by
Smith Jeremy and Smashey Christina L
Purchase Details
Closed on
Jul 24, 2009
Sold by
Oortman John E
Bought by
Smashey Christina L
Home Financials for this Owner
Home Financials are based on the most recent Mortgage that was taken out on this home.
Original Mortgage
$111,823
Interest Rate
5.36%
Mortgage Type
FHA
Purchase Details
Closed on
Aug 22, 2003
Sold by
Oortman John Evert and Doris Wel
Bought by
Oortman John E and Oortman Doris R
Purchase Details
Closed on
May 7, 1999
Sold by
Rajaraman Hariharan and Sita Swami
Bought by
Oortman John Evert and Doris Wellauer
Purchase Details
Closed on
Dec 12, 1996
Sold by
Chancey Ronald E
Bought by
Rajaraman Hariharan and Sita Swami
Purchase Details
Closed on
Jun 10, 1996
Sold by
Petra Development Inc
Bought by
Chancey Ronald E
Create a Home Valuation Report for This Property
The Home Valuation Report is an in-depth analysis detailing your home's value as well as a comparison with similar homes in the area
Purchase History
| Date | Buyer | Sale Price | Title Company |
|---|---|---|---|
| Smith Jeremy Colin | -- | -- | |
| Smith Jeremy | -- | -- | |
| Smashey Christina L | $139,900 | -- | |
| Oortman John E | -- | -- | |
| Oortman John Evert | $97,400 | -- | |
| Rajaraman Hariharan | $89,000 | -- | |
| Chancey Ronald E | $20,000 | -- |
Source: Public Records
Mortgage History
| Date | Status | Borrower | Loan Amount |
|---|---|---|---|
| Previous Owner | Smashey Christina L | $111,823 |
Source: Public Records
Tax History
| Year | Tax Paid | Tax Assessment Tax Assessment Total Assessment is a certain percentage of the fair market value that is determined by local assessors to be the total taxable value of land and additions on the property. | Land | Improvement |
|---|---|---|---|---|
| 2025 | $3,211 | $121,758 | $12,000 | $109,758 |
| 2024 | $3,211 | $115,627 | $12,000 | $103,627 |
| 2023 | $2,268 | $107,575 | $12,000 | $95,575 |
| 2022 | $2,427 | $86,087 | $10,400 | $75,687 |
| 2021 | $2,128 | $73,159 | $10,400 | $62,759 |
| 2020 | $1,908 | $66,610 | $10,400 | $56,210 |
| 2019 | $1,711 | $60,391 | $10,400 | $49,991 |
| 2018 | $1,628 | $57,948 | $10,400 | $47,548 |
| 2017 | $1,595 | $56,994 | $10,400 | $46,594 |
| 2016 | $1,399 | $51,205 | $10,400 | $40,805 |
| 2015 | $1,345 | $49,534 | $10,400 | $39,134 |
| 2014 | $1,371 | $50,238 | $10,400 | $39,838 |
Source: Public Records
Map
Nearby Homes
- 129 Pheasant Run
- 125 Bernice Dr
- 2114 Malcom Estates Dr
- 1715 Whistling Creek Crossing Unit Lot 21
- 540 Aubrey Dr
- 141 Spetchley Way
- 105 Tall Tree Rd
- 109 Tall Tree Rd
- 110 Spetchley Way
- 210 Tall Tree Rd
- 325 Twin Oaks Cir
- 1901 Atlanta Hwy
- 280 Morning Dr
- 501 Greenlee Rd
- 1921 Atlanta Hwy
- 2464 Savage Rd
- 1811 McNutt Creek Rd
- 1851 McNutt Creek Rd
- 351 Morning Dr
- 250 Custom
- 146 Pheasant Run
- 154 Pheasant Run
- 140 Pheasant Run
- 161 Pheasant Run
- 165 Pheasant Run
- 155 Pheasant Run
- 163 Pheasant Run
- 151 Pheasant Run
- 125 Meadowlark Ct
- 115 Meadowlark Ct
- 145 Pheasant Run
- 196 Pinenut Ln
- 188 Pinenut Ln
- 193 Pinenut Ln
- 139 Pheasant Run
- 180 Pinenut Ln
- 120 Meadowlark Ct
- 180 Hidden Cove Dr
- 130 Pheasant Run
- 130 Meadowlark Ct
Your Personal Tour Guide
Ask me questions while you tour the home.